In my last post, I talked about why SAS utilizes a rotated Singular Value Decomposition (SVD) approach for topic generation, rather than using Latent Dirichlet Allocation (LDA). I noted that LDA has undergone a variety of improvements in the last seven years since SAS opted to use the SVD method. So, the time has come to ask: How well does the rotated SVD approach hold up with these modern LDA variations?
For the purpose of this comparison, we used the HCA implementation of LDA models. This is the most advanced implementation we could find for LDA today. It is written in C (gcc specifically) for high speed, and can run in parallel across up to 8 threads on a multi-core machine. It does various versions of topic modeling including LDA, HDP-LDA and NP-LDA, all with or without burstiness. One of the difficult decisions when running LDA is determining good values for the hyper-parameters. This software can automatically tune those hyper-parameters for you.
We chose three different real-world data sets to do the comparisons.
- A subset of the “newsgroup” data set, that contains 200 articles from each of three different usenet newsgroups (so 600 total) from the standard newsgroup-20 collection: ibm.hardware, rec.autos, and sci.crypt. We will call this the News-3 collection.
- A subset of the Reuter-21578 Text Categorization collection. This collection contains articles that were on the Reuters newswire in 1987, together with 90-odd different categories (or tags) provided with those articles. We have included only those that contain at least one of the ten most frequently occurring tags, and label that 9,248 document subset the Reuter-10 collection.
- The NHTSA consumer complaint database for all automotive consumer complaints registered with the National Highway and Safety Administration during the year 2008. Each complaint is coded by one or more “affected component” fields. These fields have a multipart description (for example, brakes: disc). For our purposes, we utilized only the first part, which generates 27 separate general components. This data set has 38,072 observations.
Note that these three data sets vary widely in number of observations and number of natural categories. Also, one thing about topic modeling as opposed to document clustering is that we want documents to be able to contain more than one topic. In News-3, each document has only one of the categories; while in the other two data sets, multiple labels are often assigned to documents.
The natural criteria to use with these data sets is to see how well computed topics correspond to the known category structure of the data. To facilitate this, we first parsed the results using SAS Text Miner. The parsed results were fed into the Text Topic node in Text Miner to get the topics corresponding to the rotated SVD, and fed into the HCA implementations of standard LDA, LDA with burstiness, and HP-LDA with burstiness. In all three cases, hyper-parameter tuning was performed.
Regardless of which approach is tried, the number of topics is a user-defined input. In order to explore the effect of this setting, we ran all the algorithms for each data set three times
- One run was set to generate the same number of topics as categories (so 3 for News-3, 10 for Reuter-10, and 27 for NHTSA-2008).
- A second run generated # topics = 2 times (2x cat) the number of categories.
- The third used # topics = 3 times (3x cat) the number of categories.
To measure how well the category structure was discovered, for each category we identified the topic most closely related, and computed two different measures often used for external validation for clustering techniques: Normalized Mutual Information (NMI) and Purity . The results for # topics = 2x cat are shown in the graphs below. Note that higher values are considered better for both these measures.
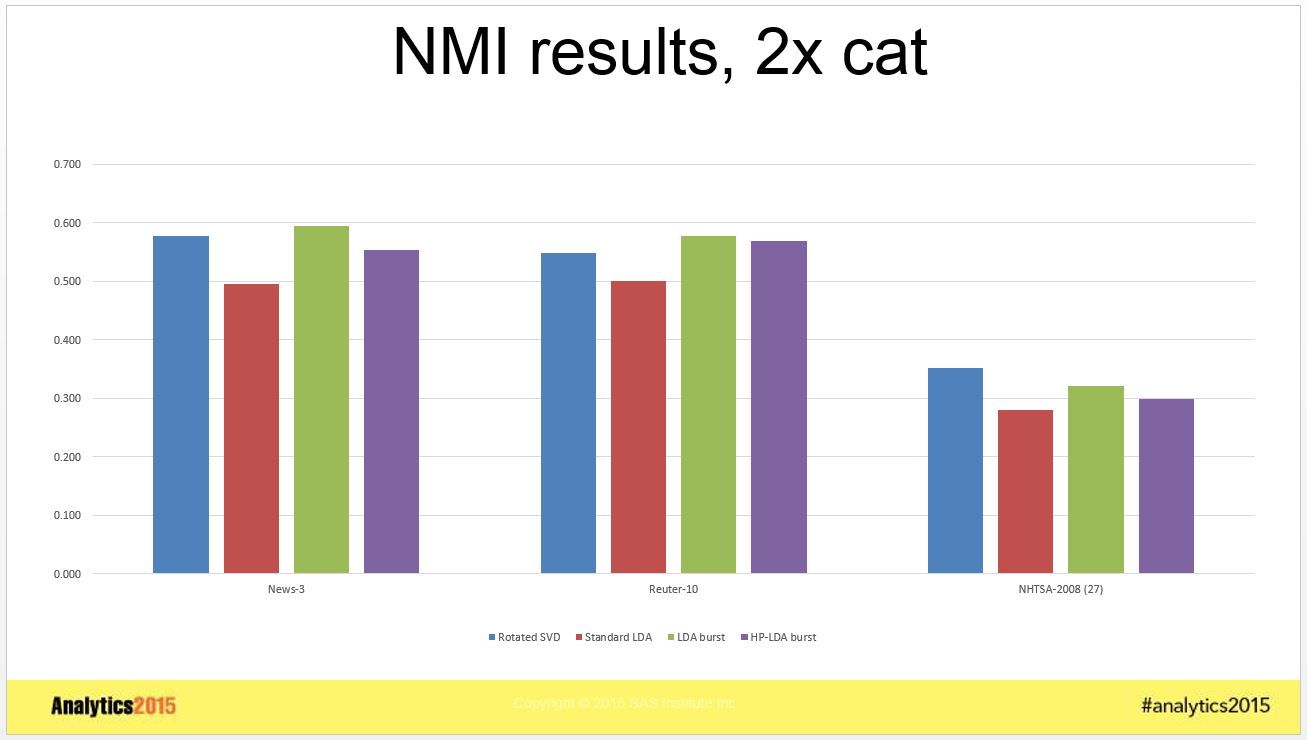
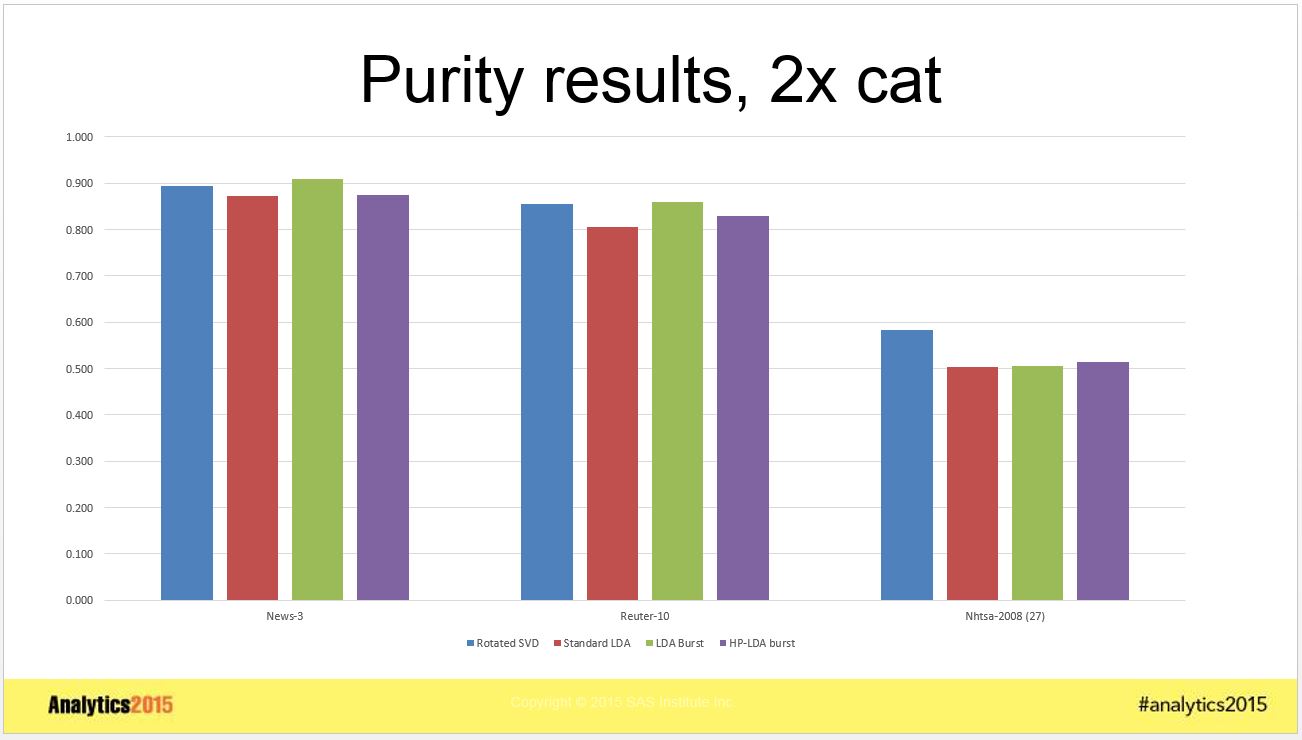
Although these graphs show results for 2x cat only, the patterns for 1x cat and 3x cat are the same.
One clear takeaway from the above graphs is that standard LDA was inferior to each of the other techniques in every case looked at, for both Purity and NMI measures. LDA with bursitness generally did better than HP-LDA with burstiness for all cases. LDA with burstiness got marginally better results for the News-3 and Reuter-10 data than rotated SVD, but rotated SVD got significantly better results for the NHTSA-2008 data.
Taking an average across the different data sets shows a slight edge to rotated SVD which is probably insignificant. From these results, it appears that both rotated SVD and LDA with burstiness do an equally good job of capturing the category structure in the data.
Going beyond these measures, there are many advantages to the rotated SVD. The SVD has what is called a convex solution, meaning that there is only one result that maximizes the objective. If you run it on the same data, it will always get the same result. LDA can generate different topics each time you run it. Furthermore, there are several hyper-parameters for LDA that have to be carefully tuned for the data. How many hyper-parameters are there for rotated SVD? Zero. Nada.
So, how does that translate in practice? It takes vastly longer to calculate LDA with burstiness, optimizing hyper-parameters, than it does to calculate SVD. For example, running the NHTSA-2008 data through the text topic node for 2x cat in Text Miner took 47 seconds. LDA with burstiness on the same data: 2,412 seconds. You do the math. We have run Text Topic node on the entire million document NHTSA collection without issue. I shudder to even contemplate running LDA on that large a collection.
Please contact me if you are interested in the spreadsheet with complete results or the specific data sets we used in this experiment. I would be happy to send them to you, and I can also address how you can go about replicating our results.
If you happen to be at the Analytics 2015 conference this week in Las Vegas, make sure you come to my talk on Tuesday, Oct. 27 at 11:30 am where I will go into considerable detail about these comparisons.
Ta-ta for now.

1 Comment
Hi James!
I'm Elena from Vienna in Austria. According to Google's timezone calculator it should be time for your talk at Analytics2015 in Vegas. Right now. But when I enter the website the live stream is paused until 1:30pm :(((
I've started my PhD in Visual Text Analytics at University of Vienna in March. I would love to see your talk about above's ........ well ......... t o p i c ........ 🙂
In fact I even wanted to record your session to be able to hear it more than once!
Is there a way to get it? SAS' youtube account seems to just cover short clips instead of long tracks of the conference.
Thanks a lot in advance!
Best
Elena