Are you eager to explore and understand your data? Do you want to improve processes and drive more revenue? Do you want to work with data using an intuitive, easy-to-use interface? This is now possible with visual analytics, technology which combines analytics with interactive visualizations.
As published in a recent TDWI Best Practices report, Visual Analytics is one of the hottest trends in BI because it empowers your employees to analyze more data faster and more frequently -- resulting in the discovery and sharing of new insights, and who doesn’t want that!?
Are you still a bit sceptical about incorporating visual analytics into your standard reports? And how it will be governed and maintained? Let me explain how visual analytics perfectly complements your other BI initiatives when applied correctly.
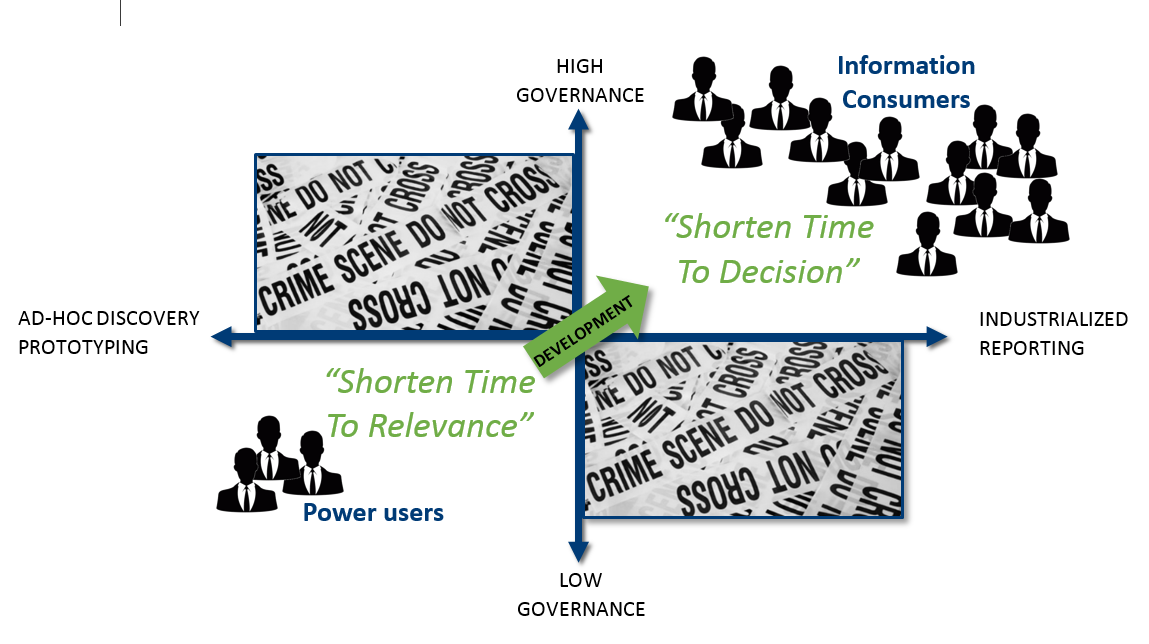
Let’s start from this quadrant where we have Ad-Hoc Discovery/Prototyping (read visual analytics) and industrialized reports on one axis and governance on the other. There are two areas where you as an organization want to be active -- and two areas you want to stay away from: The upper left and lower right. You DO NOT want high governance when you want to discover data and prototype -- and you don’t want low governance on your company’s industrialized reports.

Where you DO want to be active is the lower left and upper right area. You get there by empowering your employees with the right tools to improve the development lifecycle and drive you towards data-driven decision making. Why? Because your employees will be able to:
- Answer ad-hoc questions with just a few clicks.
- Easily include new data sources and perform a quick validation of the added value.
- Perform a first validation of hypothesis.
- Explore data and share insights that add depth to the industrialized reports.
- Collaborate more easily.
When you start working this way and let visual analytics complement your standard reports, you’ll save time to relevance and decision. And you’ll find out valuable insights from your employees as they explore data and add to the company’s dashboard and reports.
Key takeaway: With (self-service) visual analytics, your employees get involved in open-ended data exploration which enhances the potential deliverable (such as a report or application). Start looking for opportunities NOW to optimize business processes through smarter and faster decisions. What’s the benefit of visual analytics according to you? Where could your company use improvement? Let me know your thoughts.