A strong quote from John Tukey explains the essence of data visualization:
“The greatest value of a picture is when it forces us to notice what we never expected to see.”
Tukey was a famous American mathematician who truly understood data – its structure, patterns and what to look for. Because of that, he was able to come up with some great innovations, like the box plot. His powerful one-liner is a perfect introduction to this topic, because it points out the value of seeing things that we never expected to see.
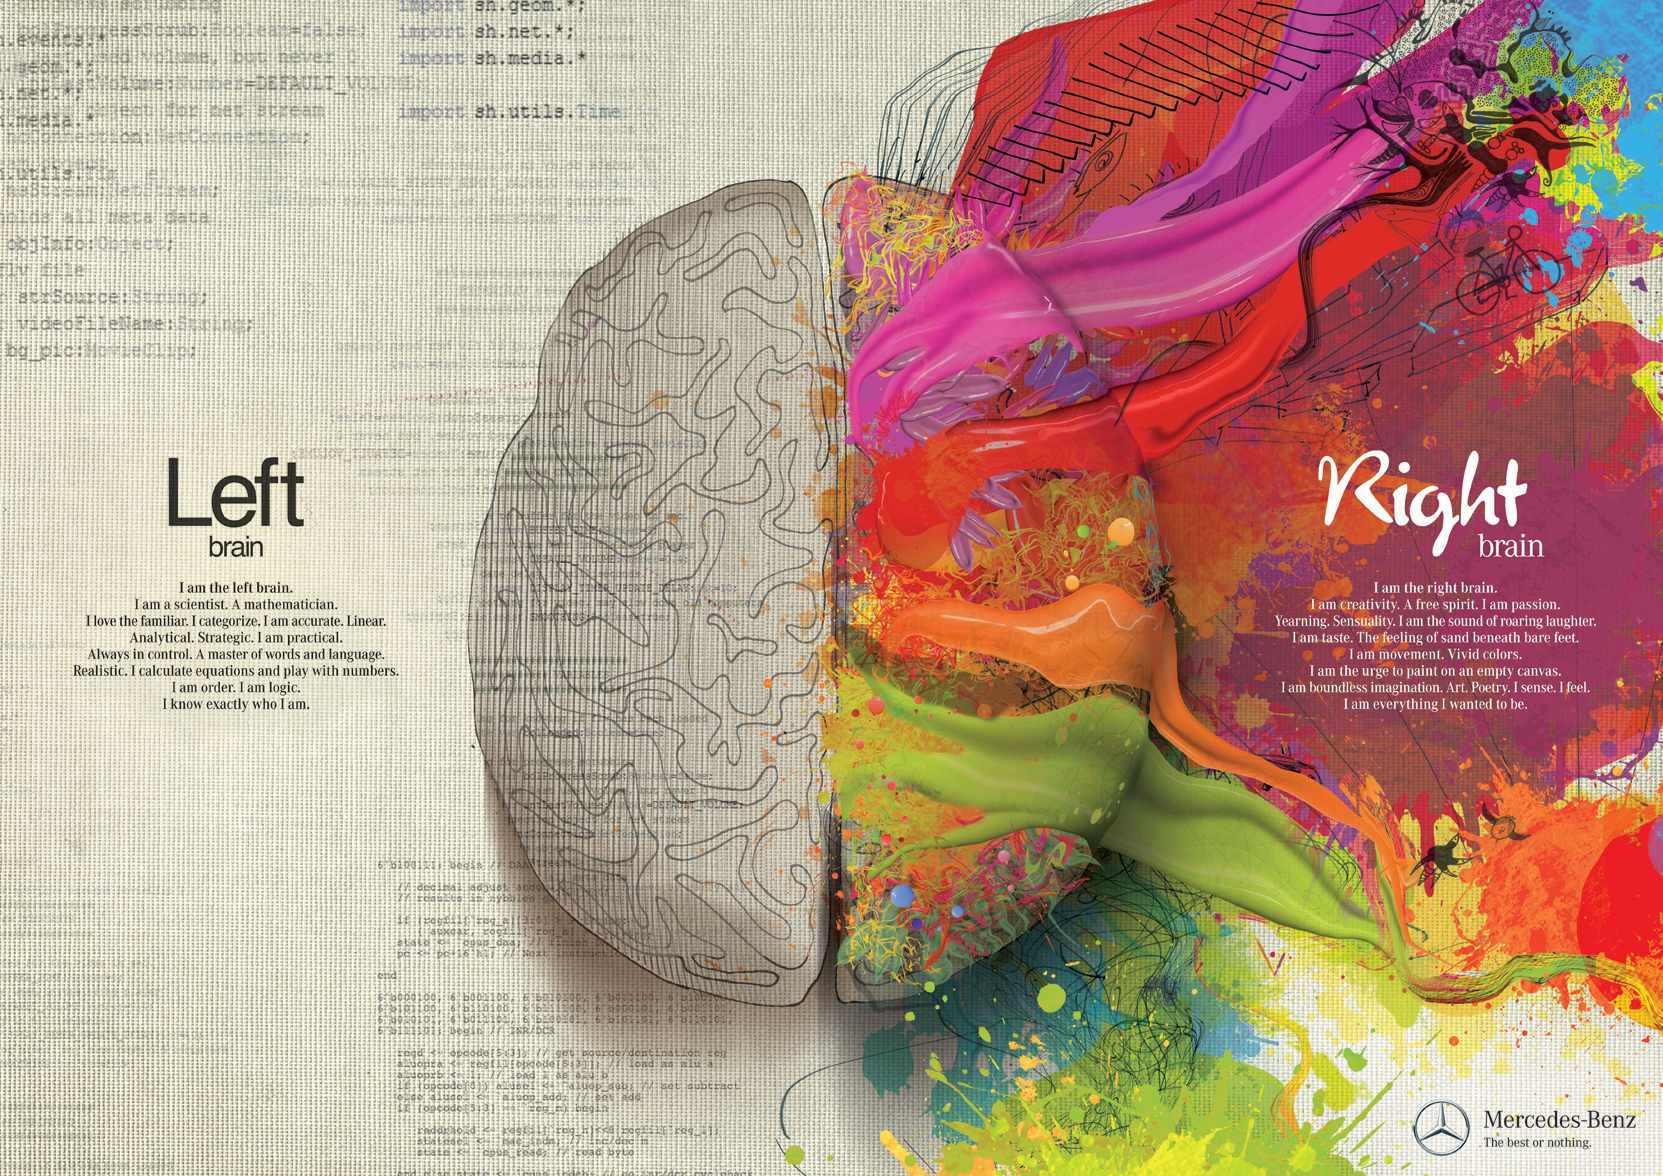
With the large amounts of data generated every day, it’s impossible to keep up by looking at numbers only. Applying simple visualization techniques helps us to “hear” what the data is telling us. This is because our brain exists in two parts. The left side is logical, the mathematician; the right side is creative, the artist.
Mercedes-Benz, the luxury carmaker, illustrated the value of visualization in its “Whole Brain” campaign in 2012. Ads showed how the two opposing parts of the brain complement each other. They juxtaposed the left side responsible for logic and analysis with the creative and intuitive right side. Through visualization, the campaign communicated that Mercedes-Benz, like the brain, is a combination of opposites. Working together, they create technological innovation, breakthrough engineering, inspiring design and passion.

Visualizing data, i.e. combining left and right sides, lets you optimize decision-making and speed up ad-hoc analysis. That helps you see trends as they’re occurring and take immediate action when needed.
The most impressive thing is that accurate and informative visualizations are just a click away for you, even as a business user. NO technical background or intensive training required at all. With self-service capabilities of modern tools, you can get much more value out of your data just by pointing and clicking.
Data visualization plays a critical role in a world where so much data is pouring in from so many sources every day. It helps us to understand that data more easily. And we can detect hidden patterns, trends or events quicker than ever before. So start using your data TODAY for what it’s really worth.
Feel free to connect with me (LinkedIn/Twitter), or to get in touch if you want to explore possibilities together.

2 Comments
Excellent blog Natan
Pingback: "Analytics": meaning and use - The Text Frontier