Have you noticed how your smart phone seems to know everything about you? Where you live, where you work, and even how long your daily commute will take!
A lot of that information is generated by your daily activities while using your connected devices. There is much to be found by analyzing the massive amounts of data generated by the Internet of Things (IoT), and smart organizations are starting to do just that.
Wouldn't it be cool if you had this power too? To collect your own IoT data and then to explore it to find patterns and insights? Well, you can! In this three-part series, you will find out how SAS Visual Analytics gives you the power to explore your very own Internet of Things!

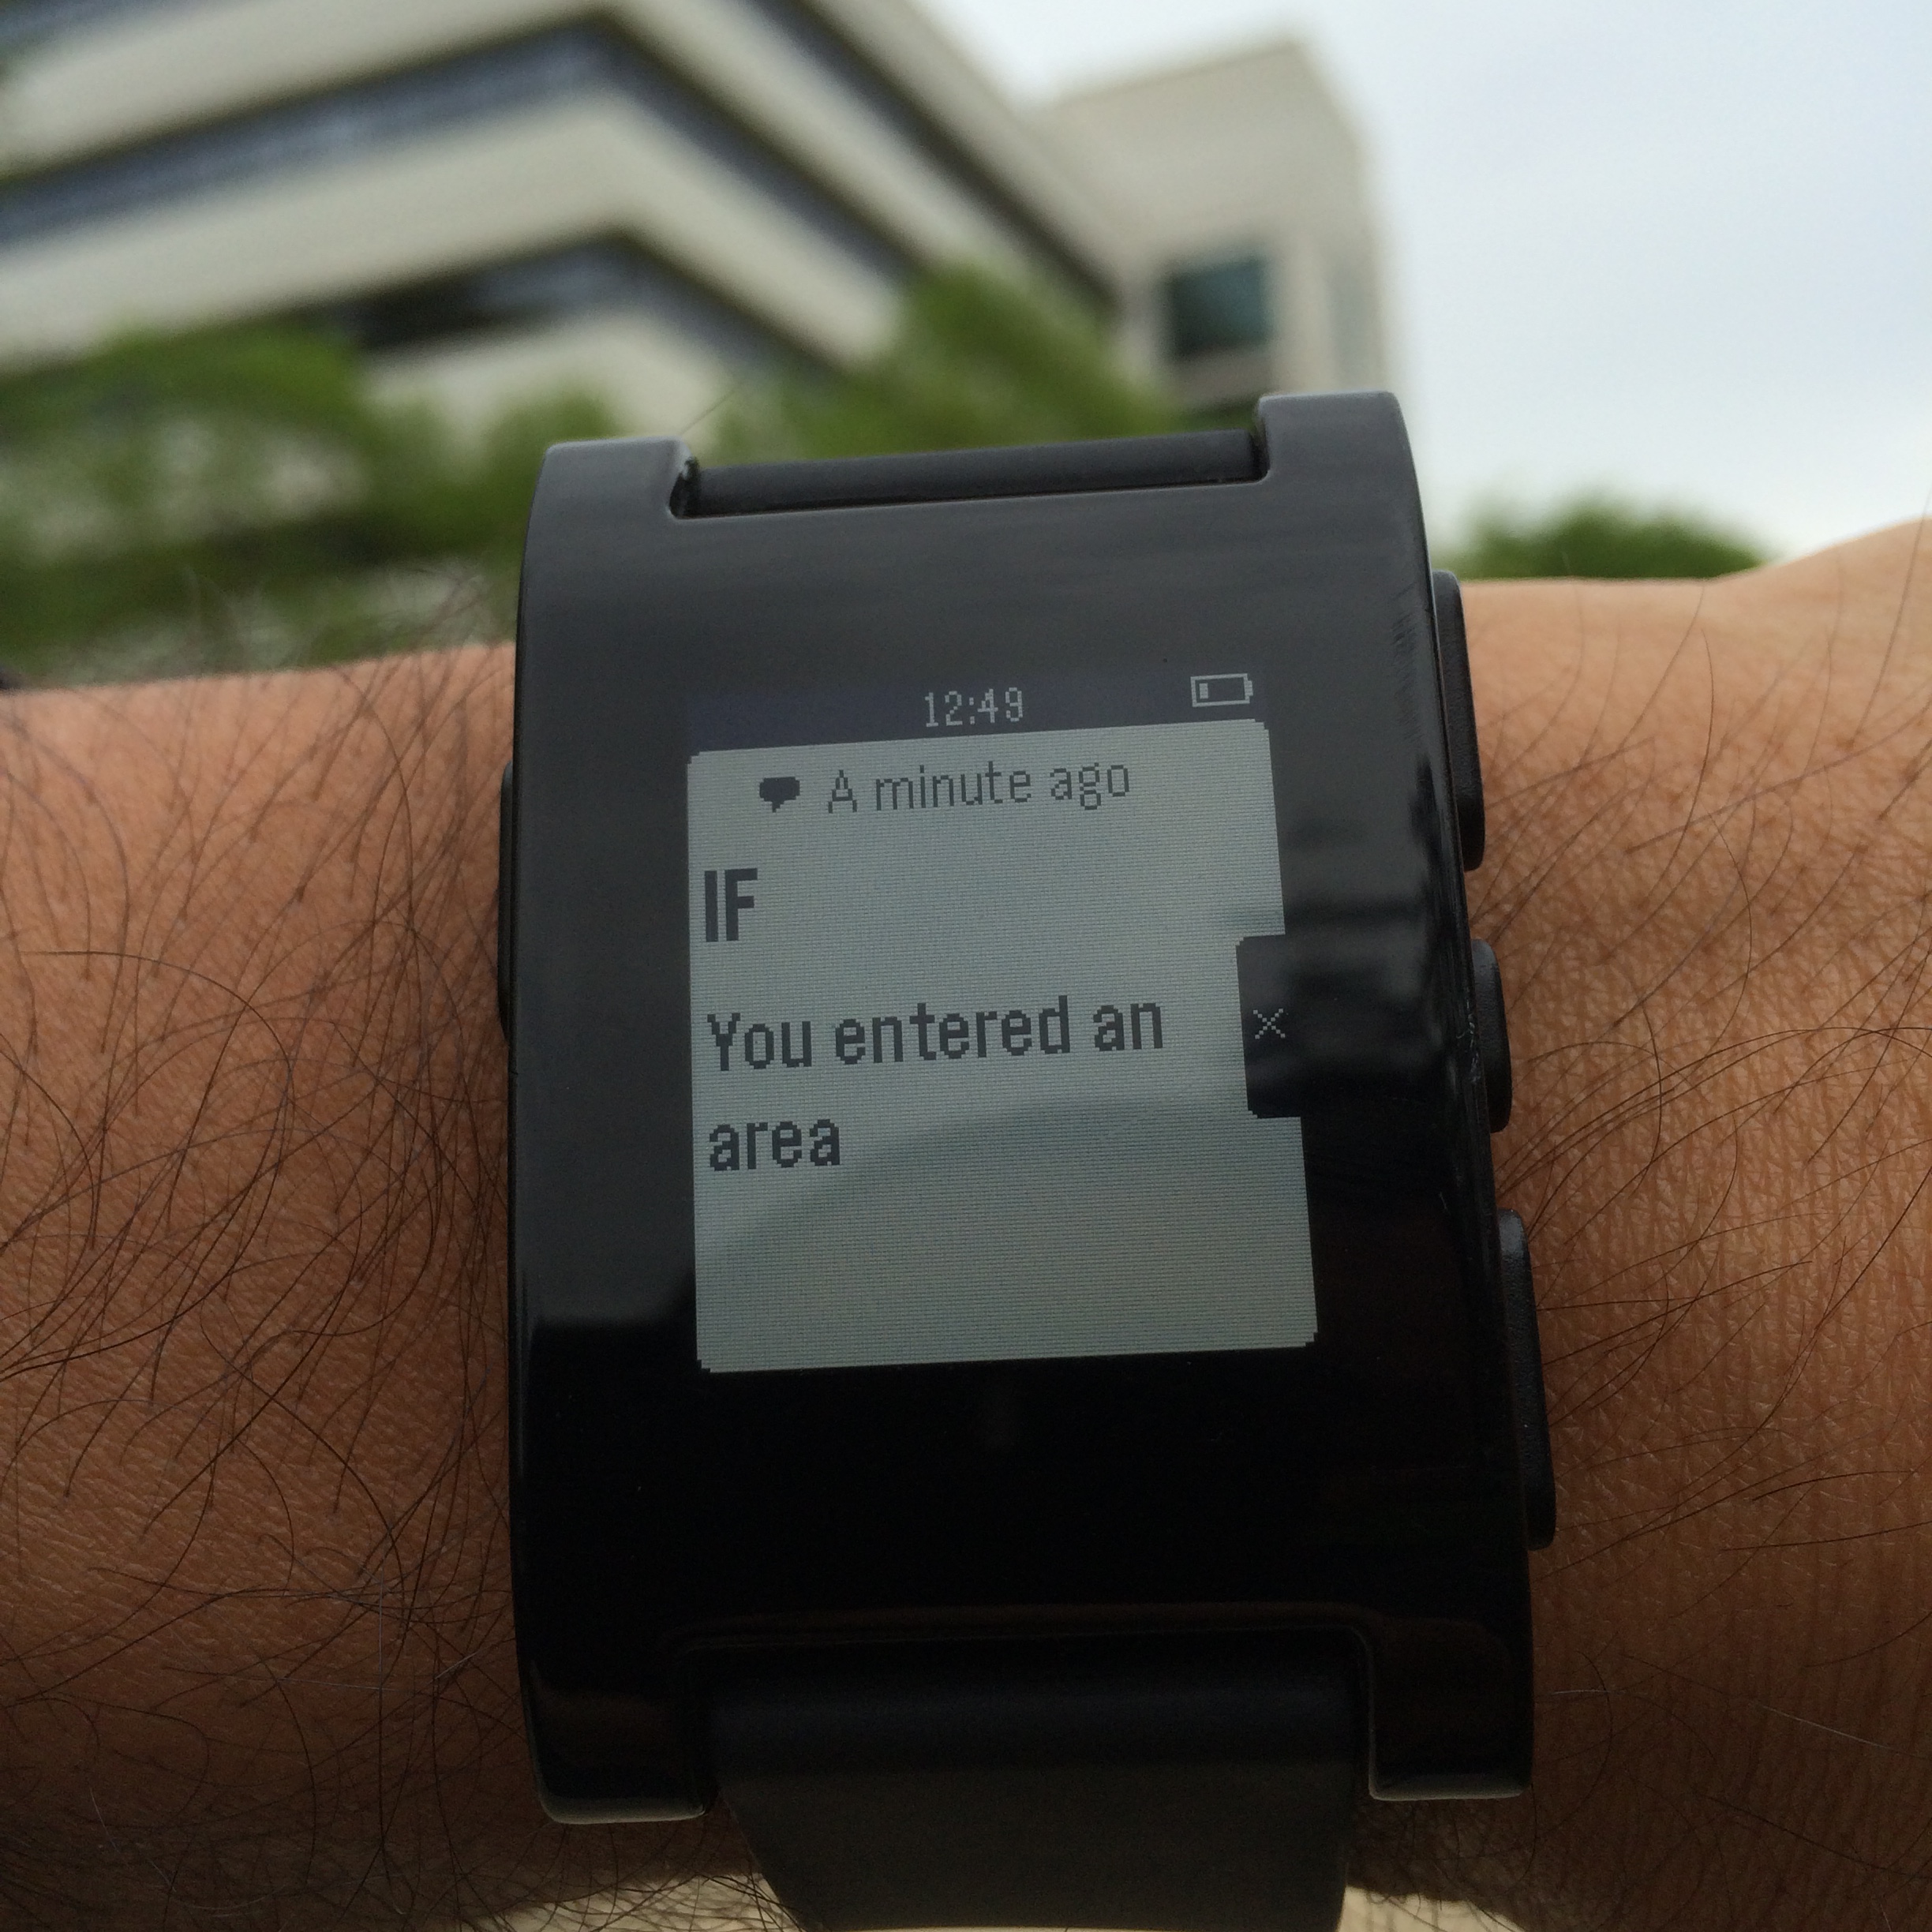
I set out to run an experiment where I would collect my own IoT data and then analyze it with visual analytics. My iPhone would be the data generating "thing," the data would be captured with an app called IF, from IFTTT.com. IFTTT stands for "if this then that." It allows the creation of simple rules with a condition ("if this") that when satisfied triggers an action (" then that").
My IF rules would check when I was entering a few pre-defined locations - my home and the SAS headquarter buildings I usually go to like my office and places where I have meetings, attend training classes, or just have lunch. The condition relies on a process called geofencing, where the current position of the device (provided by the iPhone's onboard GPS) is compared with a given location - in this case, the coordinates of a SAS building.
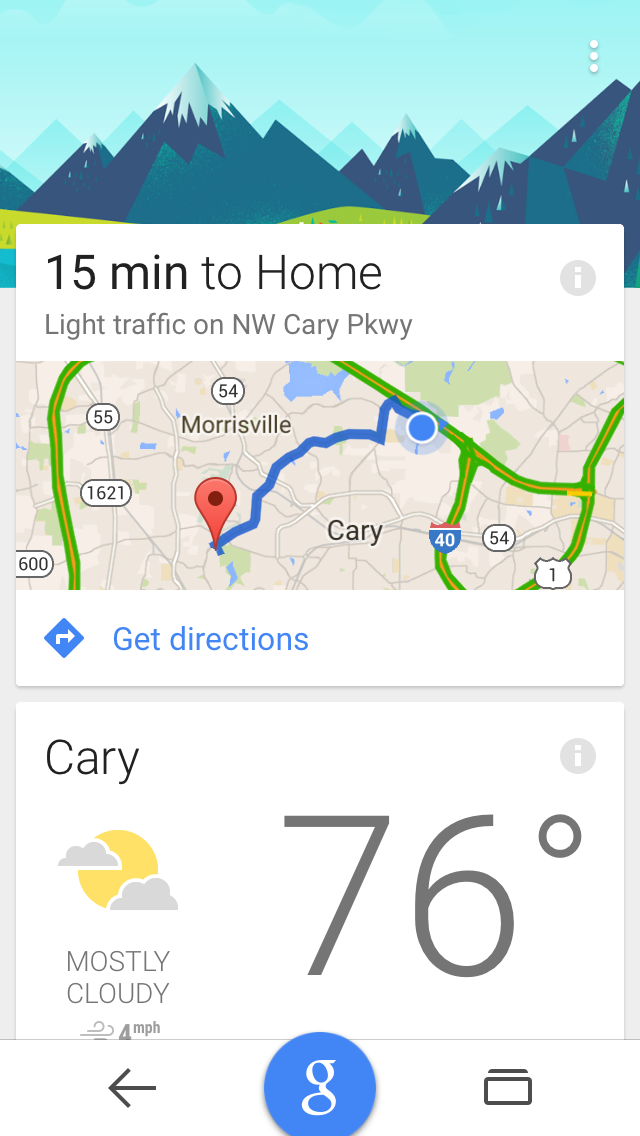
Later I found out that geofencing rules are not triggered by exact matches - you just have to enter an area around the defined coordinate. That area extends well beyond the physical walls of the buildings, as you can see in the next image. You might trigger the rule when driving by a building or parking close to it. We will factor this in our analysis later.
Every time one of the geofencing triggers was activated, IF would carry on the second part of the rule by adding a row to a Google Docs spreadsheet with information about the event. As the days went by, the spreadsheet grew, automatically accumulating snapshots of my coordinates as I moved around. Sweet! I was building my very own IoT dataset!
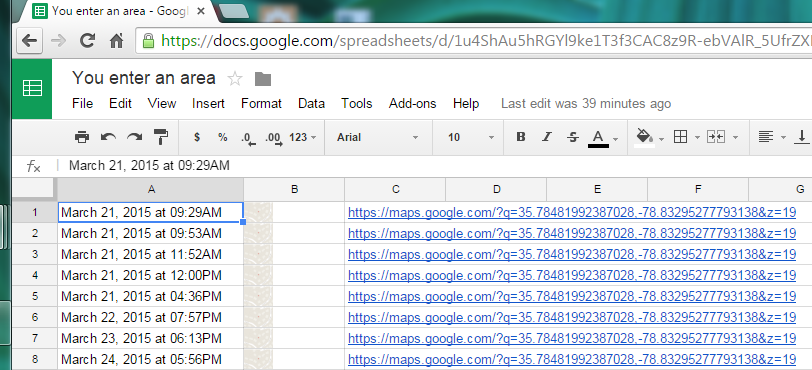
But a closer look at the spreadsheet showed that collecting the data would be the first step of many steps in my exploratory journey. It would take a while to get the data ready for analysis. In the next part of our series on personal analytics, we will look at data preparation tasks, and see how SAS Visual Analytics can help us with them.
3 Comments
Can't wait to read the rest of this series! I'm about to start a similar project using University Edition. Will start collecting data soon.
Glad you liked it Becky! The next part will be published next week.
fantastic idea. Am going to download IF also. It would be fun to see what insight you can pull off from VA on that data..