When it comes to library amenities, it’s tough to top those at North Carolina State University.
The historic D. H. Hill Library on North Carolina State University’s campus boasts an ice cream shop that whips up sundaes and milkshakes with NC State’s own ice cream.
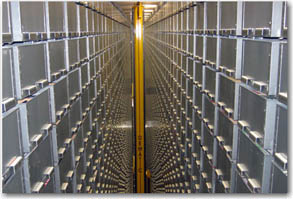
But when the new James B. Hunt, Jr. Library opened in January 2013, it served up more than 31 flavors of modern collaboration spaces, electronic walls, recording studios, 3D printing and the ultimate robotic search engine: the bookBot, which stores books in 1/9 the space of traditional shelving.
In the bookBot, books are barcoded, sorted by size, and stored in over 18,000 bins. Library patrons browse and request materials through a computer interface and request for the book to be delivered via a system of robotic cranes and delivery locations.
The Hunt Library attracted plenty of visitors who practically salivated over the space in its debut year, but what effect did it have on actual book circulation – the long-standing bread and butter of college campus libraries?
David Dickey, WiIliam Neal Reynolds Professor of Statistics at NC State University and SAS instructor/author, read between the stacks to find out, and he shared his experience in his April 27 presentation at SAS Global Forum.
T-test reveals the bad news
Dickey said he initially conducted a naïve and unjustified t-test, which showed that the new Hunt Library had no significant impact on overall book circulation.
What? Shiny new digs, drool-worthy robotics, yet no significant impact in circulation? “If you’re a statistician, one thing you have to do is explain our crazy profession to other people,” he said.
But this was no closed-book case, and Dickey opted to dig further.
The plot worsens
“If you do an analysis without doing a plot first, I hope you have your malpractice insurance paid up because that is statistical malpractice,” he said.
Dickey prepared a scatter plot and a series plot, deploying a less naïve model to address the seasonality of book circulation during the academic year. No surprise, circulation naturally decreased dramatically during the summer months and college breaks. “We shouldn’t have done the t-test because there are seasonal effects in there,” he said. “We had the wrong model.”
Dickey turned to the Box-Jenkins “airline model” to address the seasonality, and that’s when even more insights emerged. But this time the outcome actually indicated a decrease in overall circulation. “So we have an even greater decline since the opening,” he said. “What do I do?”
The right model shines light on the darkness
Once again, Dickey found himself wondering how he would break the news. “You don’t want to torture the data until it confesses!” he said. “But at that point I did two important things: I took the time to think a little bit, and I plotted the residuals.”
In doing so, he explored the idea that students might be turning to online search engines more than libraries for their information, and he was able to spot a common trend. The same slope indicated that seasonal trends and the shift away from printed books to online sources was happening long before the new Hunt Library opened.
“It pays to be careful,” he said. “It pays to think!”
Dickey shared seven takeaways from the experience:
- Results should be explainable.
- Signs of autocorrelation could really be signs of model misspecification.
- Level shifts and trends can be confused with each other.
- Level shifts and trends can affect each other.
- Know and check your assumptions.
- Plot your data and your residuals.
- For time series, use series plots, not scatter plots.
Watch Dickey’s full presentation and view other breakout sessions from SAS Global Forum.