“Let’s assume a normal distribution …” Ugh! That was your first mistake. Why do we make this assumption? It can’t be because we want to be able to mentally compute standard deviations, because we can’t and don’t it that way in practice. No, we assume a normal distribution to simplify our decision making process – with it we can pretend to ignore the outliers and extremes, we can pretend that nothing significant happens very far from the mean.
Big mistake.
There are well over a hundred different statistical distributions other than “normal” available to characterize your data. Let’s look at a few of those other major categories that describe much of the physical, biological, economic, social and psychological data that we may encounter as part of our business decision and management process.
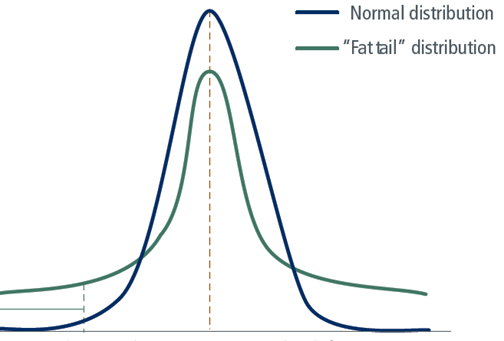 The big one when it comes to its business impact is what is commonly known as the “fat tail” (or sometimes, “long tail”). These are Nassim Taleb’s “Black Swans”. In the real world, unlikely events don’t necessarily tail off quickly to a near-zero probability, but remain significant even in the extreme, and as Taleb points out, become not just likely over the longer term, but practically inevitable. It is these fat tail events that leave us scratching our heads when our 95% confident plans go awry.
 Next up are the bounded, or skewed distributions. Some things are more likely to happen in one direction than in the other. Unlike with a normal distribution, the mode, median and mean of a skewed distribution are three different values. ZERO represents a common left-hand bound, where variables cannot take on negative values. Many production and quality issues have this bounded characteristic, where oversize is less common than undersize because you can always remove material but you can’t put it back on (additive manufacturing excepted). Too large of a part will sometimes simply just not fit into the tool / jig, but you can grind that piece down to nothing if you’re not paying attention (I have a story about that best saved for another post).
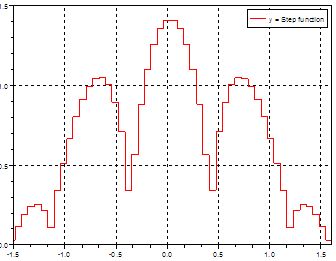 Discrete or step-wise functions might describe a number of our business processes. We make a lot of yes/no, binary, or all-or-nothing decisions in business, where the outcome becomes either A or B but not a lot in between. In these cases, having a good handle on the limited range over which making an assumption of normality becomes important.
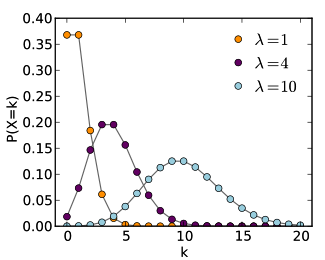 Poisson distributions. These describe common fixed-time interval events such as the frequency of customers walking in the door, calls coming into the call center, or trucks arriving at the loading dock. Understanding this behavior is critical to efficient resource allocation, otherwise you may either overstaff, influenced by the infrequent peaks, or understaff without the requisite flexibility to bring additional resources to bear when needed.
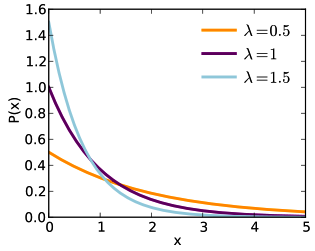 Power laws. Would you think that the population of stars in the galaxy follows a normal distribution, with sort of an average sized star being the most common? Not even close. Small brown and white dwarfs are thousands of times more common than Sun-sized stars, which are tens of thousands of times more common than blue and red giants like Rigel and Betelgeuse. Thank goodness things like earthquakes and tornados follow this pattern, known as a “power law”.
 Much of the natural world is governed by power laws, which look nothing at all like a normal distribution. Smaller events are orders of magnitude more likely to occur than medium sized events, which in turn are orders of magnitude more likely than large ones. Power laws grow exponentially in hockey stick fashion, but are typically displayed on a logarithmic scale, which converts the hockey stick into a straight line (left). Don’t let the linearity fool you, though – that vertical scale is growing by a factor of ten with each tick mark.
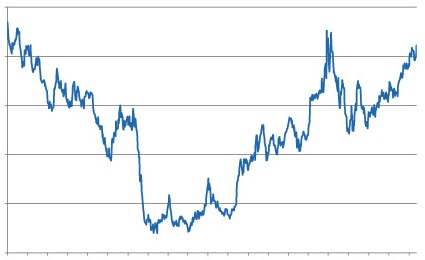 That’s financial data over there to the right – can you tell without the axis labels if that’s monthly, hourly or per-minute price data? Or, it could just as easily be your network traffic, again measured by the second or by the day. This type of pattern is known as fractal, with the key property of self-similarity: it looks the same no matter what scale it is observed at. Fractals conform to power laws, and therefore there are statistical approaches for dealing with them.
One piece of good news is that when it comes to forecasting, you don’t have to worry about normality - forecasting techniques do not depend on an assumption of normality. Knowing how to handle outliers, however, is crucial to forecast accuracy. In some cases they can be thrown out as true aberrations / bad data, but in other cases they really do represent the normal flow of business and you ignore them at your peril. In forecasting, outliers often represent discrete events, which can be isolated from the underlying pattern to improve the baseline forecast, but then deliberately reintroduced when appropriate, such as holidays or extreme weather conditions.
What we’ve just discussed above is called data characterization, and is standard operating procedure for your data analysts and scientists. Analytics is a discipline. One of the first things your data experts will do will be to run statistics on the data to characterize it – tell us something about its underlying properties and behavior – as well as analyze the outliers, all part of the discipline or culture of analytics.
Economists like to assume the “rational economic man” – it permits them to sound as if they know what they are talking about. Likewise, assuming a “rational consumer” (customer data is going to comprise a huge chunk of your Big Data) who behaves in a “normal” fashion is pushing things beyond the breaking point. While plenty of data sets are normal (there are no humans ten times the average height, let alone even twice), don’t assume normality in your data or your business processes where it’s not warranted.
Soon enough we’ll probably drop the “big” from Big Data and just get on with it, but still, your future is going to have a LOT of data in it, and properly characterizing that data using descriptive analytics in order to effectively extract its latent value and insights will keep your Big Data exercise from turning into Big Trouble.