I'm an avid Star Wars fan, and am cautiously optimistic about what J.J. Abrams intends to do in Star Wars VII. The cast for the movie was revealed earlier this week, and today is May the Fourth, an unofficial Star Wars holiday. You might be asking yourself what any of this has to do with SAS. Well, as a Star Wars geek, I took it upon myself earlier this year to analyze the scripts from the original trilogy--A New Hope, The Empire Strikes Back and Return of the Jedi. How do you analyze script files? You break them down using SAS Data Management and SAS code, analyze them with SAS Contextual Analysis and then display the results using SAS Visual Analytics!
I downloaded the script files from the Internet Movie Script Database. There's a wealth of very cool unstructured data on that site! To give you an idea of what I started with, here's a snippet of the original data for A New Hope:
A long time ago, in a galaxy far, far, away...
A vast sea of stars serves as the backdrop for the main title. War drums echo through the heavens as a rollup slowly crawls into infinity.
It is a period of civil war. Rebel spaceships, striking from a hidden base, have won their first victory against the evil Galactic Empire. During the battle, Rebel spies managed to steal secret plans to the Empire's ultimate weapon, the Death Star, an armored space station with enough power to destroy an entire planet. Pursued by the Empire's sinister agents, Princess Leia races home aboard her starship, custodian of the stolen plans that can save her people and restore freedom to the galaxy...
How do you get started when all you have is big blocks of text? I used SAS Data Management and SAS code to extract data and create a dataset I could visualize. Character names, locations and time periods always preceded lines of text in the scripts. Given that level of consistency in formatting, it became simple to pull those items out. I combined the original trilogy scripts into a single dataset and created structured variables for location, time periods, characters, the source movie, and the actual script line associated with the other variables. The next step was to visually explore the unstructured data using SAS Contextual Analytics.
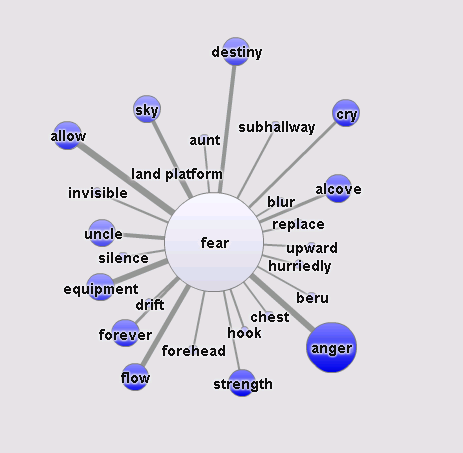
I had a lot of fun looking at the scripts in SAS Contextual Analytics. One of my favorite features in SAS Contextual Analytics is term mapping, which give insights into the ways terms are related. Here are a few of my favorite examples.
This term map is a beauty! There's a nice link between fear, anger and destiny. Some of the most iconic moments in the entire Star Wars franchise revolve around this path to the Dark Side. In the Empire Strikes Back, during Luke's Jedi training, Yoda says: "Yes, a Jedi's strength flows from the Force. But beware of the Dark Side. Anger, fear, aggression - the dark side of the Force, are they. Easily they flow, quick to join you in a fight. If once you start down the dark path, forever will it dominate your destiny." Darth Vader tells Luke Skywalker: "You have learned to control your fear, now release your anger, only your hatred can destroy me."
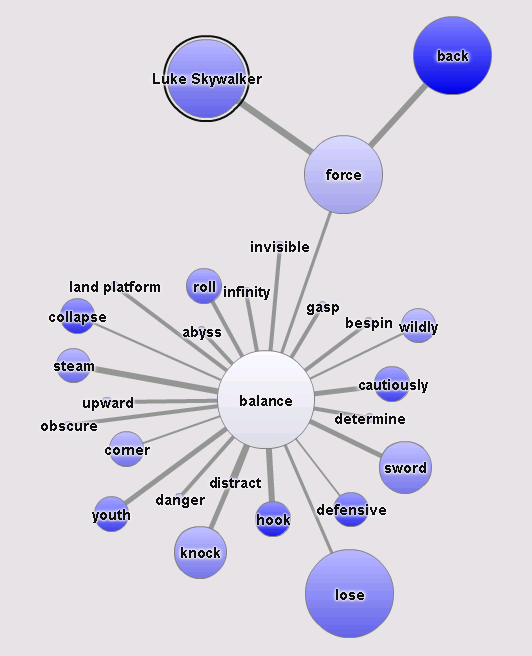
This term map gives me chills. It looks as though it's telling us that Luke Skywalker is the one who will bring balance back to the Force, even though there are more than a few arguments about who the "chosen one" really was.
SAS Contextual Analysis can also be used to build taxonomy rules so you can categorize data. Categorizing provides even more structured variables. In my exercise, I built rules for Bad Guys, Good Guys, Systems, mentions of the Dark Side and the Force, and Weapons. Between the data processes and categorization, I ended up with fourteen structured variables--all derived from big blocks of text! Here are a few of my favorite SAS Visual Analytics graphs using my derived variables.
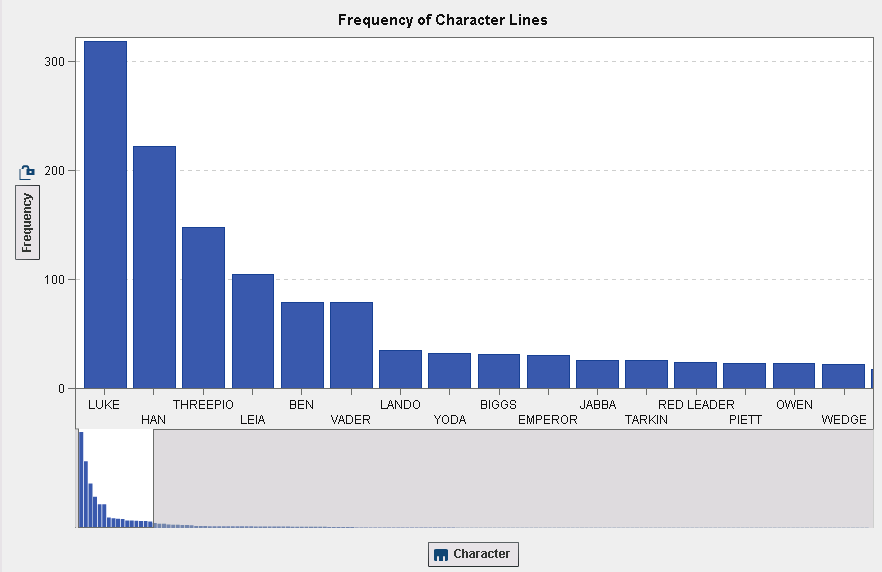
This chart shows the distribution of character lines in the original trilogy. I've been asked why R2D2 doesn't show up on the list. It's because he never has any truly defined lines. There are references to his whistles and beeps, but no spoken lines.
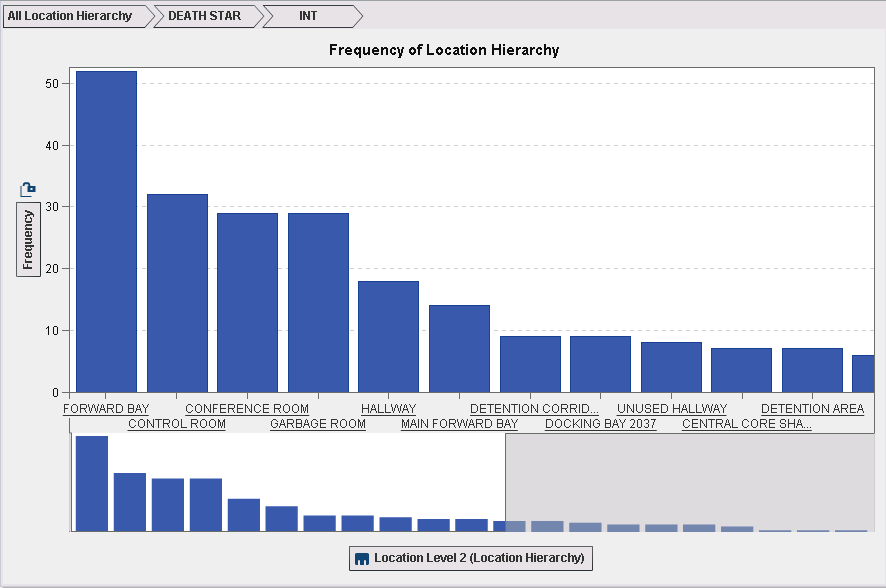
The location data provided in the scripts was so rich, I was able to pull out multiple levels, which worked well in a hierarchy in SAS Visual Analytics. This chart shows the distribution of interior locations in the Death Star.
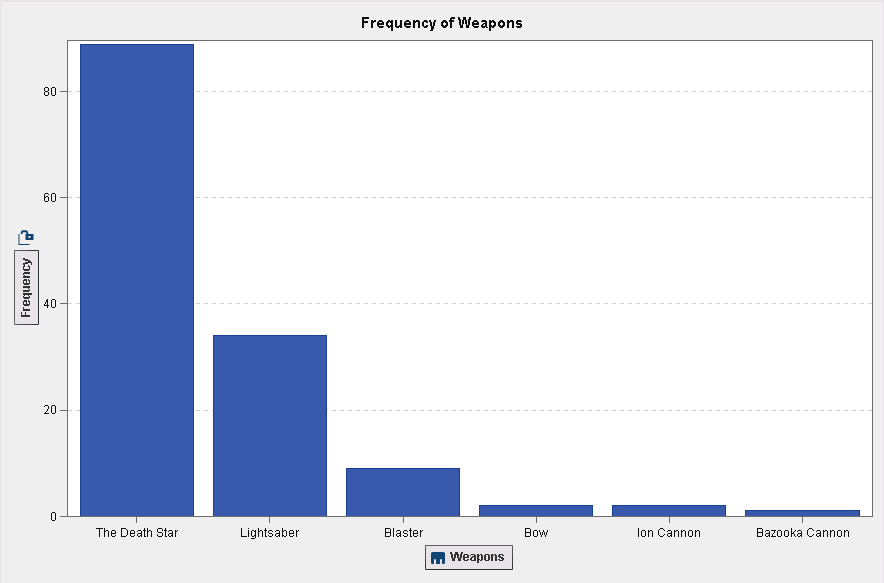
This final chart shows that the Death Star really was regarded as the ultimate weapon. It was mentioned more than twice as many times as lightsabers!
If you want more details, check out my paper from SAS Global Forum 2014, Star Wars and the Art of Data Science, and May the Fourth be with you!