At SAS, we’ve always been smart about using our own software internally to support our business goals. For an example, read Chris Hemedinger’s post about the SAS program he designed to measure blog activity - and one decision the blog team made as a result. Or, you can read several examples of “SAS using SAS” success stories.
Just like any business, we have a lot of data. A lot of data. And, different types of data used for different reasons. We talk a lot about SAS Visual Analytics – and how it can help you explore relevant data quickly and easily. We also like to say anyone can use SAS Visual Analytics, from the business user to the analyst.
The use of SAS Visual Analytics here at SAS is a great example of the simplicity and power of the product. Today, more than 20 different departments at SAS are using SAS Visual Analytics for their data exploration and global reporting needs. Business users. Analysts. Data Scientists. It’s quite impressive, actually.
Let me share with you three very cool examples:
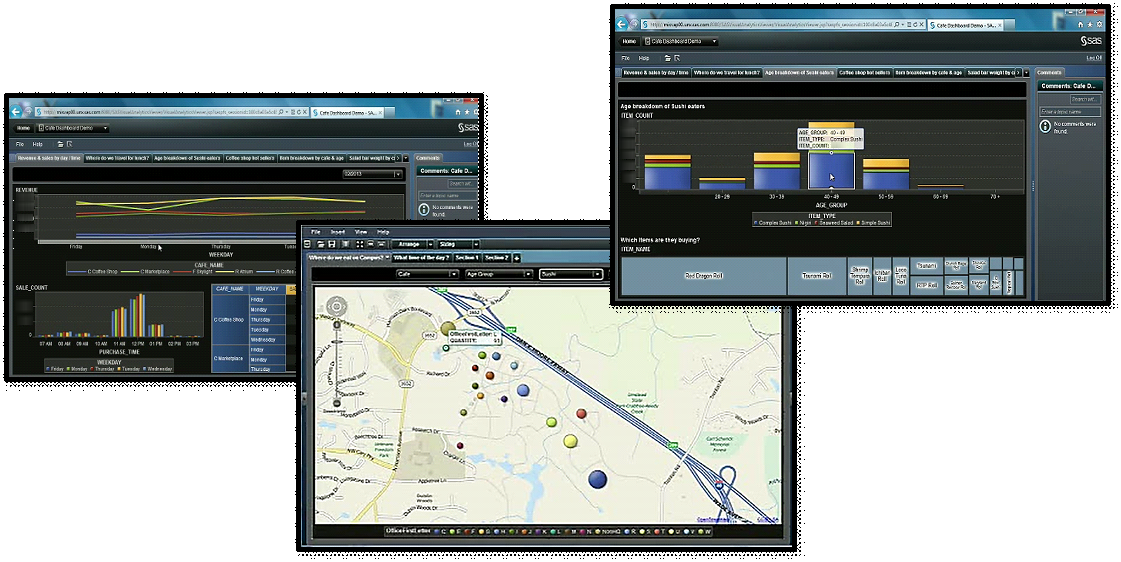
1.) At our Cary Campus in North Carolina, SAS has four full-service cafes, three “food-to-go” cafes, and two coffee shops. Our food & beverages organization serves nearly 6,000 employees every day and caters on-campus meetings and conferences.
Decision makers from the food & beverage team use SAS Visual Analytics to explore all of our café purchase data. The analysis help us make sure we keep our employees favorite meals on the menu. And, helps us plan staffing to adjust for peaks or lulls in the use of the cafes.
If you look at the geomap of our campus, you can see which cafes are the most popular. You can also see revenue trends for each café, by day and by hour –which (among other things) lets the managers know the peak busy-time for each café on campus. After all, they want to make sure we have enough staff on hand to efficiently serve employees and guests.
And, as a fun aside: I’ve included a drill down into a visualization of sushi purchases broken down by age group and type. I can quickly see that the 40-Somethings love fancy sushi … with the Red Dragon Roll being the favorite! Who would have guessed?! (For privacy purposes, it’s worth noting these reports only include non-identifiable employee information).
- Visualizing Food & Beverage purchases at SAS
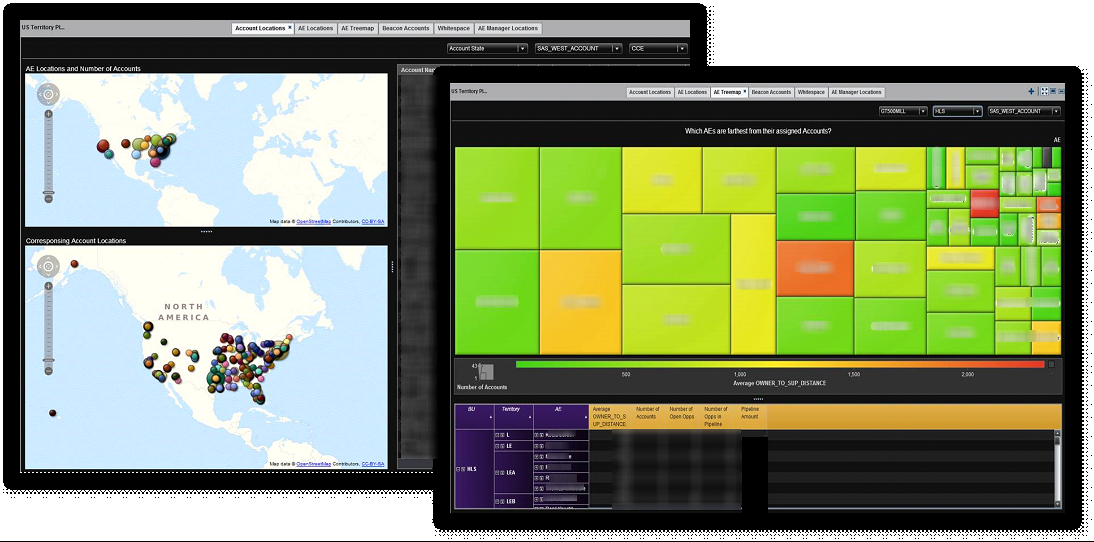
2.) Carl Farrell, Executive Vice President of Sales for SAS Americas, and his leadership teams use SAS Visual Analytics for their Sales Performance Dashboards and Territory Planning, among other things. In this example, for territory planning, we are examining where our account executives are located and the proximity of their location to their strategic accounts. I’ve scrubbed out company and employee names for this external post, but internally managers have all the information they need to be sure they’re supporting SAS’ top customers with employees who are close by when needed.

- Visualizing AE proximity to Strategic Accounts
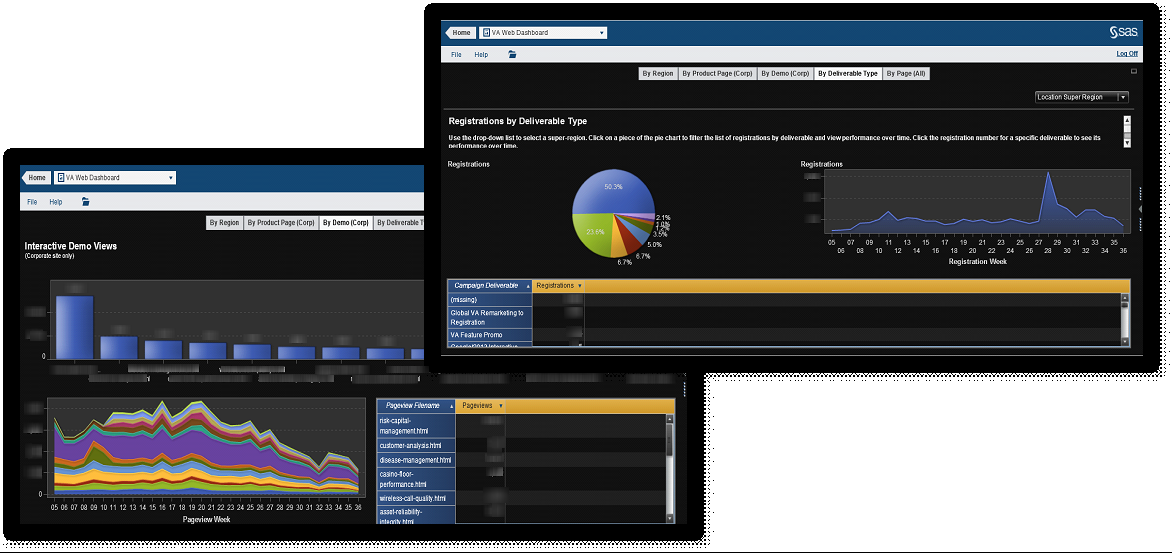
3.) Finally, SAS marketing executives use SAS Visual Analytics to explore web traffic data about our SAS Web sites. The interactive reports make it easy to explore detailed information about the many assets used in marketing campaigns, from white papers to Webcasts to blog posts.
In this example, you can see web traffic for the SAS Visual Analytics web pages, including which items on the pages have the highest number of registrations. The report shows peaks in registrations over time, so you can drill down to explore which campaigns were tied to those peaks and evaluate the factors that influenced the increase in web traffic.

- Visualizing website traffic to asses campaign performance
I hope these examples give you a few ideas of how you can use SAS Visual Analytics. I’d love for you to have the same ability to explore your company's data. Why not visit the SAS Visual Analytics page on sas.com to learn more or TRY IT, yourself. TODAY.
Many thanks to Brandon Kirk of SAS IT, and Alison Bolen and Waynette Tubbs of external communications for helping with this post.

3 Comments
Hey Jennifer ..
Those are some pretty cool insights. I like that you guys use your own products - probably it helps the product in a lot of ways.
Out of curiosity ... how many people does SAS have administering all that data? Any idea how much data is even loaded?
Tricia
Hello Tricia,
I am in SAS IT and manage the environment. We currently have ~800GB loaded in memory which can fluctuate as business units adhoc data into memory for analysis then drop it back out when complete. Our VA administrative reporting projections currently have us over 1TB within the next month based on data growth and additional subject areas currently being on-boarded.
Our VA team consists of an OS admin, a SAS Admin, and four data prep experts that are liaisons to the business consumers (These resources have additional responsibilities as well).
Brandon
I'm one of the analysts that is a business consumer of Brandon's environment. The entire process is automated, so after the initial work was done to set up the automated data load process, it pretty much runs itself until we desire new features or want to install more infrastructure to handle more data. For example, the web traffic data process is totally automated--so we simply "set it and forget it," and simply look at the report to analyze the data as needed.
There are so many things to learn from the data, and it's so easy to create reports and explore, that more and more business consumers are asking for more, which is why we very much appreciate having staff dedicated to adding new data areas.