 Chances are, you have a breaker box or a fuse box in your home.
When you plug one too many appliances into an outlet in your kitchen and overload the circuit, a circuit breaker trips to protect the wiring and to prevent a fire. The handy description next to each breaker tells you exactly which one to flip to reconnect the current-- after, of course, unplugging that extra blender or waffle maker. The description maps the breaker to the location in your house whose wiring it protects.
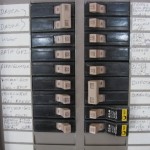
Imagine if the descriptions were missing. Several friends told me that when they bought their homes, the descriptions were missing. They had to do a lot of running from room to room, turning things on and off, to figure out which breaker was associated with which room or major appliance. As tedious as this was, they realized that taking the time to fill in the missing descriptions would prevent huge inconvenience in the future.
Similarly, the IT organization can be in the dark about how SAS is physically and logically laid out – across physical boxes, tiers, directories, folders, and servers. And, since I mentioned servers: in SAS speak, servers can be physical or virtual boxes, or they can be logical locations where certain activities take place, like the workspace server, stored process server, OLAP server, and many others. Not having a clear picture of where and how SAS is installed and the storage and work areas it requires can lead to all sorts of problems. At one organization I know of, a well-meaning IT professional, in his effort to free up some disk space, deleted the temp space associated with the workspace server. The SAS users were suddenly unable to do any work, and the phones and emails in the data center went wild.
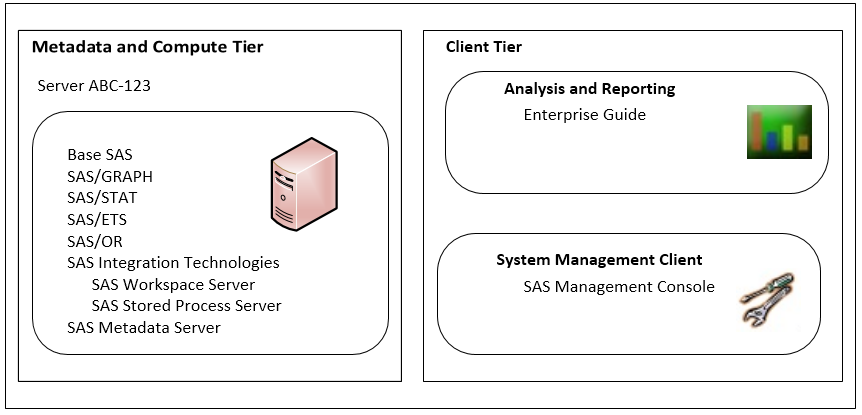
It is well worth the time and effort for SAS users and IT to work together to develop a schematic diagram of the SAS environment. The first layer of the diagram represents the hardware – the arrangement of physical or virtual boxes on which SAS is installed. In a small SAS shop, the diagram might show a single physical server with representations of client PCs that access the server to run SAS jobs. More complex environments can consist of these elements and more:
- Multiple compute (also called application) servers (where SAS jobs are run).
- A metadata server which keeps track of users, permissions, stored processes, and more, and which acts like the traffic cop directing SAS traffic around the system.
- Databases.
- Middle tier for Web access.
Having this infrastructure laid out in an easy to read diagram can greatly add to the understanding of the environment, which is critical for such operational tasks as monitoring and backups. It also improves reaction time if anything goes wrong.
A second layer to the schematic diagram shows the components of SAS software installed on each box. For example, one application server might be used for the general “SAS Stack” – let’s say Base SAS®, SAS/STAT®, SAS/GRAPH®, and SAS/ETS®. A second application server is used for more computationally intense work, so the diagram lists SAS® Enterprise Miner™ and SAS® Forecast Server and required additional components. This layer of detail is especially important at upgrade and migration time, as well as when SIDs (license renewal keys) are applied each year.
Finally, a third layer indicates where the various logical servers, like the workspace server and stored process server, are located. These are especially mysterious to IT, because they are purely SAS-based constructs, but when they are associated with a physical location on a box in the data center, they become real and have definition and purpose.
Here’s an example of a schematic for a compute server running an assortment of SAS products and the PCs that run SAS tasks on it. This one is drawn with Visio, but any other drawing tool or some sharpened pencils will do the trick.
Just like the breaker box with descriptions, this sort of diagram prevents a lot of stumbling around in the dark. Let me know if you and your IT organization make use of a SAS environment diagram, and how it works for you!
Read more posts from the IT Whisperer blog series or subscribe to the series via RSS.

10 Comments
I work for a government contractor (currently CSC) and most, if not all, of our clients require detailed planning and design documents to be written prior to deployment. These typically included network diagrams with the three levels of detail (network, server, application) you describe.
Hi, Jennifer,
Thanks for your post, and thanks for the confirmation of the value of this process!
Regards,
Lisa
In the case of deleteing the temp space, we had similar in that the temp space was too small. But the users can also know how to redirect the temp space to prevent them from having too much down time. We were able to redirect our temp space by appending -work "location" to the SAS start up icon and thus proceed with our work while IT found more space for us.It was great that SAS software gives us this option, putting the workaround in the users hands (at least in my case).
Thanks for your note, Kristin. Your post cites a nice example of IT providing the SAS users with a quick way to handle what could otherwise be an "I can't get my work done" situation!
Oh, I would also recommend adding remote data sources and the communications protocol between platforms to the diagram. These two items often have a lot of 'aha!' power.
Yes - great points. Thanks!
I recently upgraded / modernized my home's electrical panel and I labeled the breakers myself, so they made sense to me. This is a reminder that your SAS (and all) system diagrams should be updated whenever you update / migrate / alter / modernize your SAS environment.
You're right, Kate. Thanks for mentioning this. Even a minor change to the environment not represented on the architectural diagram can cause confusion down the road.
Hi there! Would you mind if I share your blog with my myspace group?
There's a lot of people that I think would really enjoy your content.
Please let me know. Thank you
Yvonne, yes - please feel free to share it. I hope you and the members of your myspace group find the post helpful. Thanks!