We know that it is a struggle to gain insight from massive amounts of data. Businesses need the value that analytics provide and want to include analytics in day-to-day decision making in order to gain insights and improve business performance.
Data visualization and reporting are like the “easy button” for businesses because they show data in action – and make analytics easy to understand. SAS Visual Analytics offers analytic based visualizations that make data exploration even more valuable to businesses by providing deeper insights to data. So now, businesses can quickly explore ALL of their data, design and publish reports and dashboards based on analytics.
So, what’s new for SAS Visual Analytics 6.2? MORE:
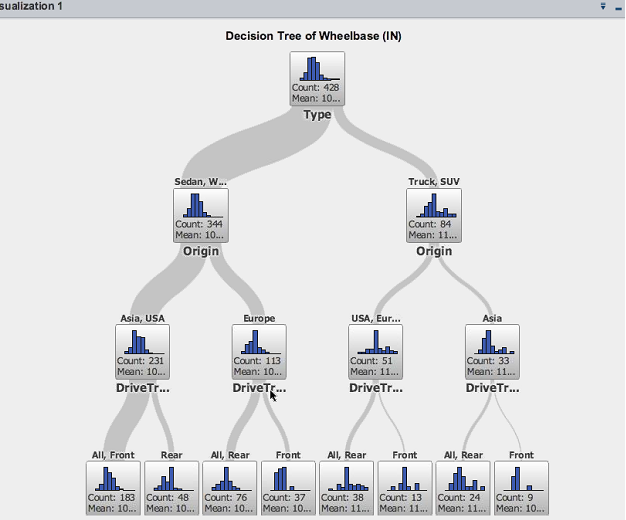
- More analytics – Like decisions trees and forecasting that lets you manipulate variable scenarios and visualize projected outcomes.
- More report designing and publishing capabilities – Enhancements to our Mobile BI app.
- More deployment choices – So whether organizations want to run SAS Visual Analytics on a Windows server, on-site, or in the cloud, SAS offers deployment flexibility to meet the business needs.
And … SAS Visual Analytics 6.2 is available on the latest version of the SAS platform: SAS 9.4, our cloud enabled platform.
Learn more or try SAS Visual Analytics, today.

2 Comments
Great to see the enhanced analytics! I think the forecasting scenario analysis will also provide tremendous insight for organizations. http://www.youtube.com/watch?v=da6Fn3Sjlcs
Thank you for your post, Michelle...and the link to the video that show cases the scenarios analysis capabilities. You are so right: The scenario analysis capabilities give analysts the ability to play some "what if" games to see how different variables might influence future outcomes which leads to great insight for organizations.