The Data Visualization Charting 101 seriesexplores different tools to visualize data. Check out other posts to see which data visualization is right for you.
My grandmother often used the saying “as the crow flies” when giving directions, referring to a straight line being the shortest distance between two points. When I hear it now, I think of her. Similarly, “as the crow flies,” line graphs are certainly the path of least resistance when displaying the relationship of one variable to another. If your data only has a few data points or if you are tracking changes over time, a line graph would be the simplest way to display the information.
Line graph basics:
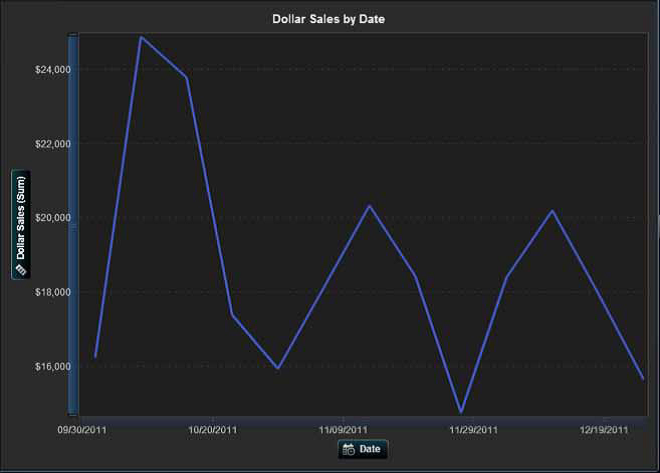
- Show the relationship of one variable to another (Figure 1).
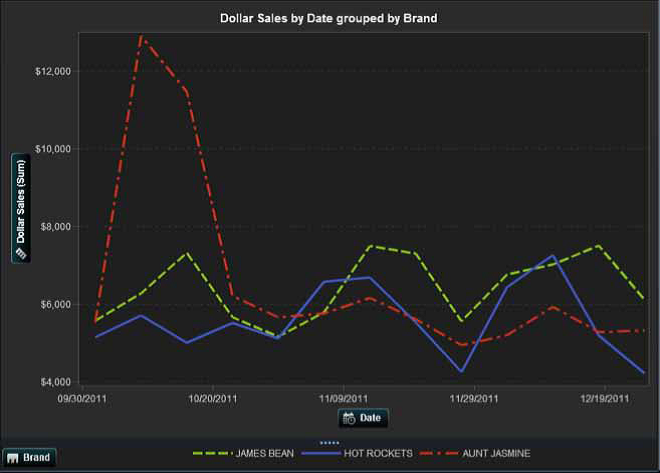
- Are used to track changes or trends over time (Figure 2).
- Are useful when comparing multiple items over the same time period.
When to use a line graph
You may want to use line graphs when the change in a variable or variables clearly needs to be displayed and/or when trending or rate-of-change information is of value.
It is also important to note that you shouldn’t pick a line chart merely because you have data points. Rather, the number of data points that you are working with may dictate the best visual to use. For example, if you only have 10 data points to display, the easiest way to understand those 10 points might be to simply list them in a particular order using a table.
When deciding to use a line chart, you should consider whether the relationship between data points needs to be conveyed. If it does, and the values on the X axis are continuous, a simple line chart may be what you need.
Think a simple line graph is the ticket for you? Learn more about which chart works best for different data sets by downloading the white paper, Data Visualization Techniques.
Also, get your hands on data visualization software SAS® Visual Analytics at the "Software Cafe" at SAS Global Forum, April 28-May 1, in San Francisco.