Remember that video we posted recently with Kimberly Holmes of XL Insurance? In it, she says the demo she saw about a fake toy company using SAS Visual Analytics sparked so many new ideas for her that she wished she had a tape recorder in her brain to capture them all.
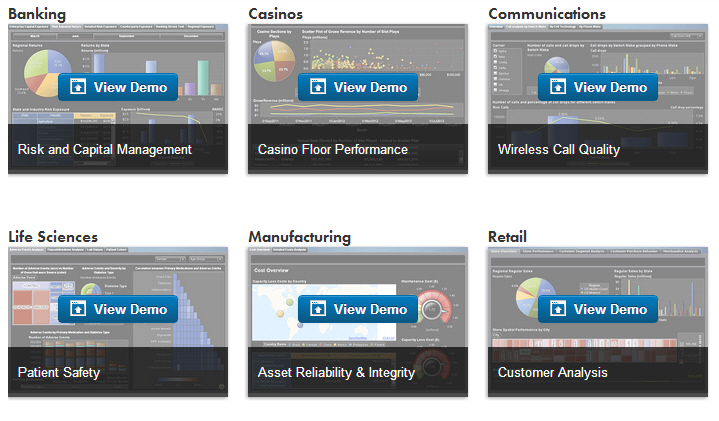
If you're looking for similar inspiration, be sure to spend some time in the new SAS Visual Analytics demo area. It includes software demos and video explanations for multiple industries and multiple roles.
Whether you're in customer service for a retail company or in finance for a life sciences organization, you'll likely find a demo that relates to your job and shows what you can discover with visual analytics. Or, if you don't find a demo that fits your job precisely, you could be like Holmes, who works in the insurance industry and found cross-industry inspiration from a toy retailer.
Once you've watched the demos, you can get full access to interact with the data on your own. It's a great opportunity to see for yourself what visual analytics can do for your organization.