I don’t know about you … but I get hundreds of e-mails a day! Not only e-mail – but text messages, tweets, e-mail advertising, notices from blogs, rss feeds…coming to me at a numbingly fast pace day and night.
It’s information overload. It’s also overwhelming. And, on a personal level – it’s big data. That little red exclamation point in Outlook lets me know that the sender deems a certain message important. But with so much information pouring in, over so many channels, how can I quickly tell what is really important to me?
Maybe, to paraphrase a bestselling book from a few years back, everything I need to know about understanding my big data I learned before kindergarten. Children start with picture books…not text books. Cities are more quickly understood through maps than street names and coordinates. Many people would rather “see the movie” than “read the book.” And that’s a good point too…why is it that we can consume a whole movie in a matter of hours …when it takes days to read a good book?
Because it is a lot easier to understand and grasp concepts through pictures than through text.
That’s why visualizing data is so important for businesses. It’s not just that a picture is worth a thousand words. It’s that reading a thousand words takes time…and, in today’s economy, there’s simply no time to waste.
Big data, on a corporate level, is way more challenging that my own personal big data issues. Billions upon billions of rows of data, flowing in from all channels, faster than it’s possible to wade through it all.
Through data visualization, companies don’t have to wade. Or wait. They can explore relationships among hundreds of variables and determine their relative importance in order to quickly build predictive models and make iterative changes on the fly. And they can display results in a way that make sense and provide context and explanation for decision makers.
Imagine having the ability, through an easy-to-use interface, to analyze all that data…all at once…all in seconds. And see what’s important immediately. Insights—at the speed of sight even for your biggest big data problems, including problems that require advanced analytics.
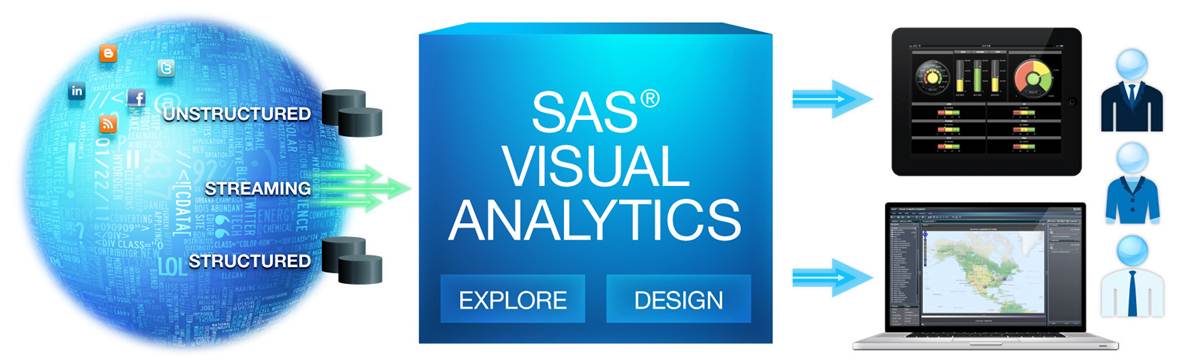
It’s not a fantasy … it’s reality, with game-changing new software called SAS Visual Analytics.
If this were an e-mail, instead of a blog, I’d put a red exclamation point beside it. And you’d probably ignore it. But don’t ignore SAS Visual Analytics…or the potential for turning your big data into even bigger insights. Take a minute and have a look yourself.