In my last blog post I revealed the WOW factor of SAS Visual Analytics. In summary: analyzing billions of rows of data, across vast numbers of columns, via 100+ correlation calculations in SECONDS (wow).
What exactly does that mean? SAS Visual Analytics takes full advantage of SAS’ high-performance analytics technology. You can visually explore all of your data (billions of rows) very quickly—revealing patterns and trends and opportunities that immediately grab your attention. And compel you to know more! That’s easy, because a highly visual and intuitive data exploration interface lets you subset and sample data in countless ways…and generate new data visualizations in minutes or seconds.
Don’t tell my children, but I think it is a lot more absorbing than a video game (sorry boys!). The ability to reach higher and higher levels of understanding—from vast pools of data—isn’t just a guilty pleasure; it’s a profitable one. 🙂
How?
SAS Visual Analytics draws its gusto from our in-memory server, SAS LASR Analytic Server, the heart and soul of our high-performance technology…with a game-changing ability to accelerate analytic computations. The one-two punch of high-performance analytics and the easy-to-use data exploration interface makes getting bountiful insights from big data a fast and repeatable feat. So you’ll not only impress your peers…you’ll impress yourself!
Okay, you already know I’m amazed by the Visual part of SAS Visual Analytics. But know what’s truly dazzling? The Analytics. SAS has always been ravenous about analytics…they’re at the center of everything we do. Seeing is believing only when you can trust what you’re seeing. And you can trust SAS analytics –we’re the world leader in advanced analytics.
-
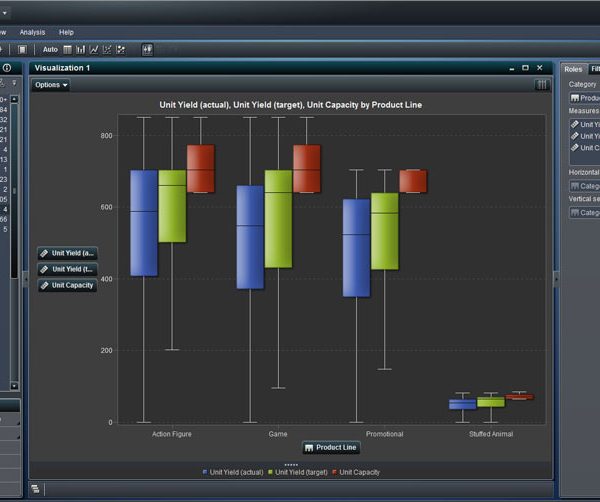
- You can quickly view and compare the distribution of your data and the distribution of data within a category.
-
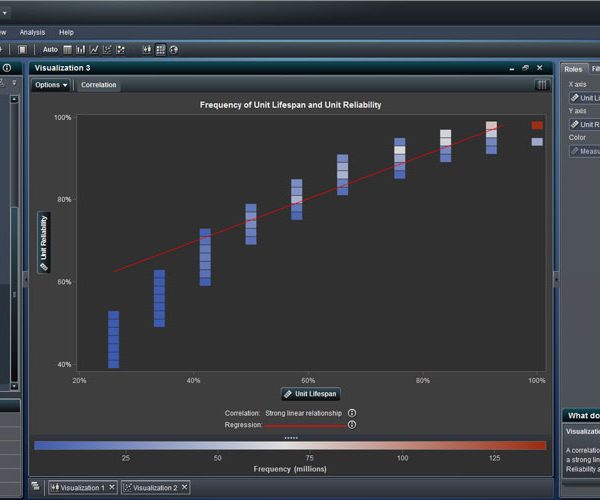
- You can quickly compare two measures to see whether or not there is a relationship and a regression line.
What You Can Do With It
Now everyone can get answers from the massive investment you’ve made in all your data. SAS Visual Analytics extends the power of SAS analytics to everyone in your organization—from novice, inexperienced users to advanced analysts.
A quick run-down of the possibilities:
- SEE THE UNSEEN: Uncover new relationships buried in data that were not previously known
- DIY: Understand analytic relationships without having to be an expert in analytics
- NO NEED TO STOP WHEN YOU’RE ON A ROLL: Determine new opportunities for further analytic exploration
- LET OTHERS IN ON THE ACTION: Design interactive web-based reports
- FACTS TO THE FIELD IN A FLASH: Publish reports and dashboards to mobile devices such as iPads
I can’t wait to hear about the amazing discoveries you make with SAS® Visual Analytics. I know I’ll be WOWed.