Traditional churn models - designed to predict whether or not customers will cancel your company's services - treat customers as isolated entities. But individual customers are not isolated entities. Rather, customers are influenced by friends, friends of friends, and others within their network.
Bart Baesens, PhD, an Associate Professor at Katholieke Universiteit Leuven has been conducting research - along with a few of his PhD research students - to determine whether network analysis can improve traditional churn prediction models in the telecommunications industry. He presented the team's findings today at the Analytics 2011 conference in Orlando.
How accurate are existing models?
Wouter Verbeke, one of Bart's research students began the project by looking at existing local models for churn prediction. He found that many of the techniques currently in use perform quite similarly. The performance of these models typically ranged from 70-90 percent accuracy with models that had ten to fifteen attributes.
Bart and his team then asked, "How can you improve those models?" One, you can improve your technique with complex modeling techniques or two, you can enrich your data. Specifically, they decided to enhance the existing regression models with social network data by asking questions like, who is my customer talking to? Who are his friends? Who is influencing him?
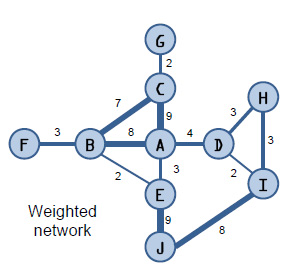 Before we go much further, I should mention that social network analysis does not typically analyze data from social network sites like Facebook and Twitter, as many people assume. Rather, it is a data mining technique that explores the patterns between people (or other entities) in a network or group. Social networks are typically illustrated through a series of nodes and edges (or ties) that show which people (or households or companies) are connected. The edges or ties can also be weighted to show the strength of the connection. (At SAS we currently have 9 telecom customers using our Customer Link Analytics product to solve this business problem.)
Enhancing models with network data
"If we can find a way to bring social network data into simple logistic regression models, we could have a white box model that improves results," hypothesized the team.
The data set Bart's team began working with included five months of call detail records on 2 million customers with a current churn rate of .5 percent. The social network created based on this data included 8,000,000 edges, and the size of the data set was about 300 gigabytes in size. Due to the complexity of determining relationships between so many entities, Bart says the analysis requires parallel computing and high performance analytics for the sparse matrix handling.
The team created a network graph that showed weighted relationships between customers based on the number of seconds they talked to each other per month. (Text messages were considered a constant 5 seconds each.)
Some of the questions they wanted to answer were:
- Were there social network effects in the data?
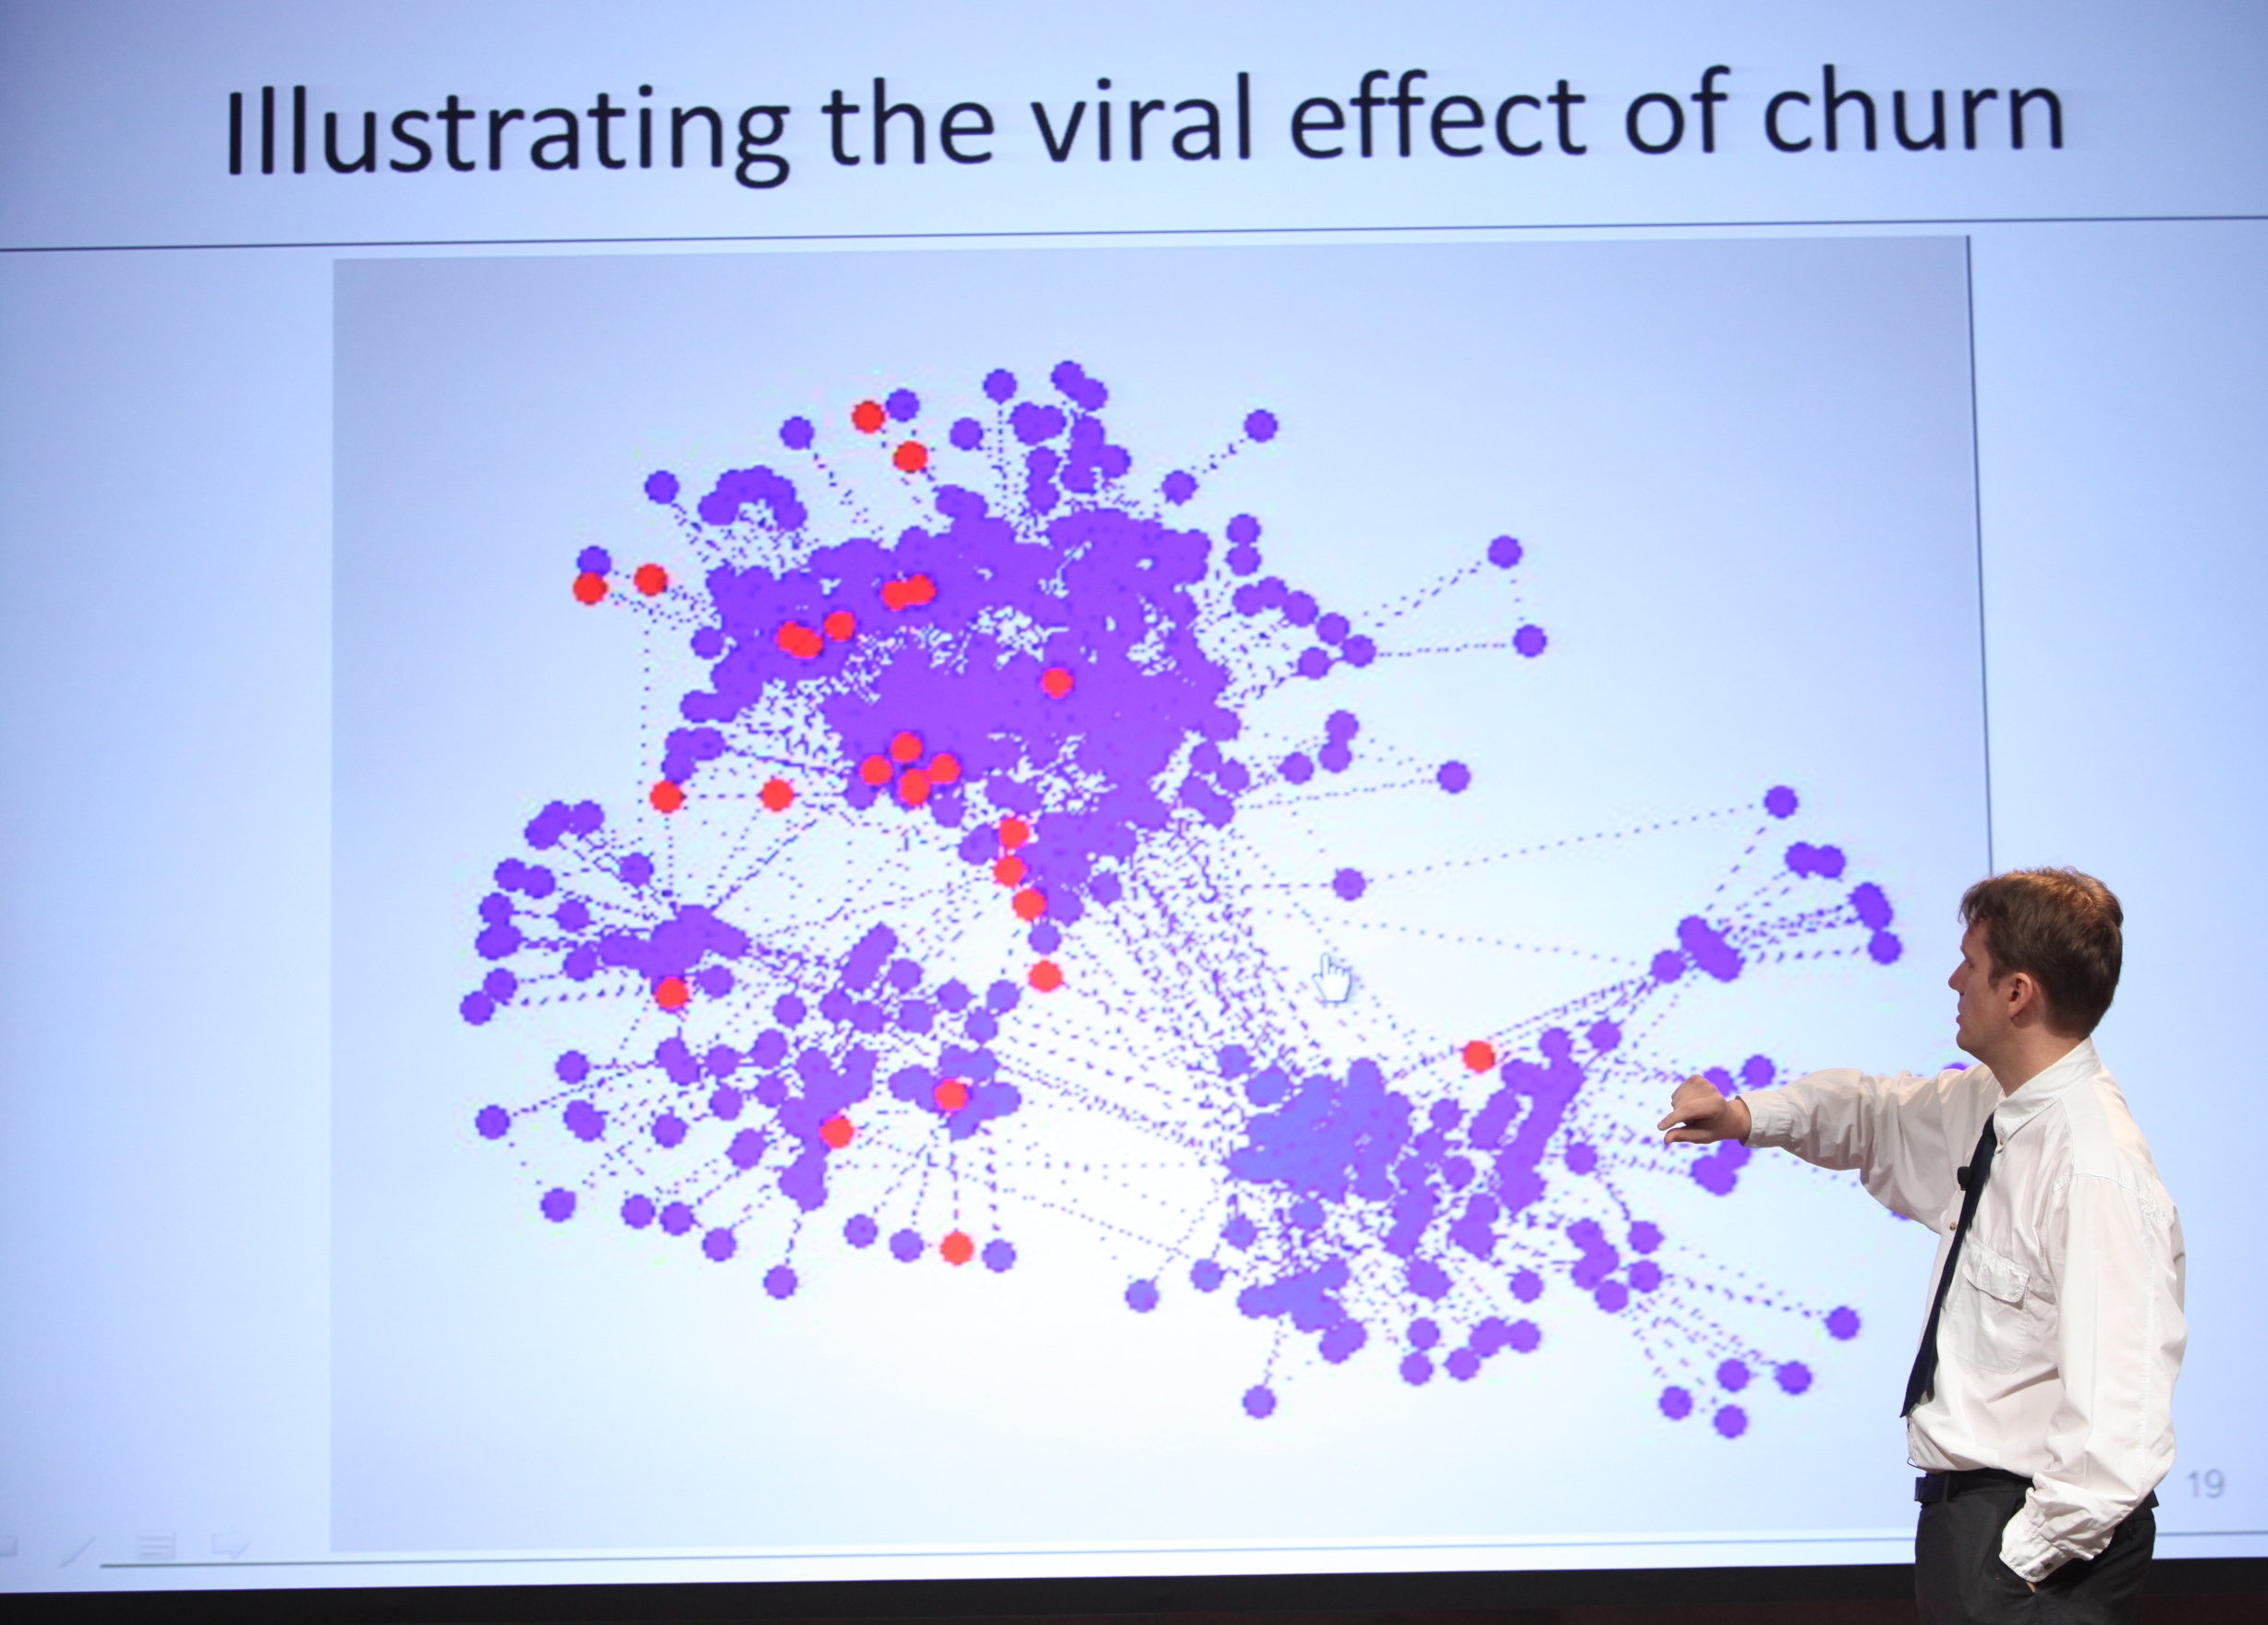
- Is there a viral effect to churn?
- Are customers influenced only by direct neighbors in the network, or are they also influenced by friends of friends?
When Bart's team first completed the network map and started looking at random samples of the data, they saw chains of churners popping up together right away. During the presentation, Bart displayed one time-lapsed section of the graph, and you could see side-by-side nodes turning red one after the other.
Working more deeply with the data, Bart's team distinguished between local variables (gender, contacts, etc) and network variables (number of international calls, how many contacts are churners, etc). They also distinguished between first-order variables (immediate connections' behaviors) and second order variables (behaviors of friends of friends).
In order to include network attributes in the traditional model, the team translated network attributes into traditional attributes and created as many as possible to do a stepwise regression. They also derived special data elements from the existing data elements in a process called featurization. And they used other techniques to infer where to start analyzing data at different points in the network.
Results show network influence
Intial results show that:
- Network models detect other types of churners compared to traditional models.
- Customers are influenced by friends within the network and by friends of friends.
- Incorporating the impact of higher order leads to improved predictors and profits.
Bart cautions that these results are from a single Belgian company, but his research team is validating them now with data from a second company. If you want to learn more about this second case, or if you are a telecommunications company with data that Bart's team could use for a third study, he welcomes contact via email or Twitter.

2 Comments
Pingback: T-Mobile fights back with customer link analysis - SAS Voices
Pingback: High-performance analytics for big customer data - SAS Voices