Tomorrow is Independence Day, a federal holiday in the United States. Flags are displayed everywhere, especially in Washington, D.C., where I live. So let's have a little Fun with Flags! The current U.S. flag has 50 stars, one per state, with five rows of six stars interleaved with four rows of five stars. This arrangement of stars was designed by hand, but can we instead construct an optimization problem for which this arrangement is an optimal solution?
Mathematical Optimization
Suppose we want to arrange stars in a rectangular region. Let
and
denote the coordinates of star
, for
. We need some way to measure the quality of a particular arrangement. What stands out to me in the current flag is that the stars are spread out in the sense that no two stars are too close to each other. One way to capture this idea with optimization is by using a maximin model that maximizes the minimum Euclidean distance between stars. Explicitly, we want to maximize
subject to lower and upper bounds on and
.
SAS Code
The following SAS macro variables record the number of stars and the width and height of the rectangular region as proportions of the overall flag height, according to the United States code:
%let n = 50; %let width = 0.76; %let height = 0.5385; |
The following PROC OPTMODEL statements capture the mathematical optimization problem just formulated:
proc optmodel; /* declare parameters */ num n = &n; set POINTS = 1..n; num width = &width; num height = &height; /* declare variables, objective, and constraints */ var X {POINTS} >= 0 <= width; var Y {POINTS} >= 0 <= height; var Maxmin >= 0; max Objective = Maxmin; con MaxminCon {i in POINTS, j in POINTS: i < j}: Maxmin <= (X[i]-X[j])^2 + (Y[i]-Y[j])^2; /* call nonlinear programming solver with multistart option */ solve with nlp / multistart; /* save optimal solution to SAS data set for use with PROC SGPLOT */ create data solution from [i] X Y; quit; |
Note that we use squared distance instead of distance in order to avoid the non-differentiability of the square root function at 0. Also, the MULTISTART option of the nonlinear programming solver increases the likelihood of finding a globally optimal solution for this nonconvex optimization problem with many locally optimally solutions.
The following PROC SGPLOT statements plot the resulting solution:
proc sgplot data=solution aspect=%sysevalf(10/19); styleattrs wallcolor='#3C3B6E'; scatter x=X y=Y / markerattrs=(symbol='StarFilled' color=white size=20); xaxis values=(0 &width) display=none; yaxis values=(0 &height) display=none; run; |
Here is the resulting plot, which is a transpose of the existing design:
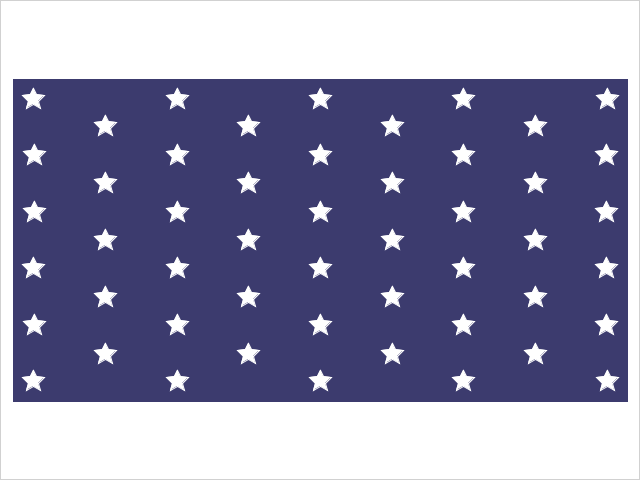
The resulting objective value is 0.0116, which corresponds to the squared distance between vertically adjacent pairs of stars.
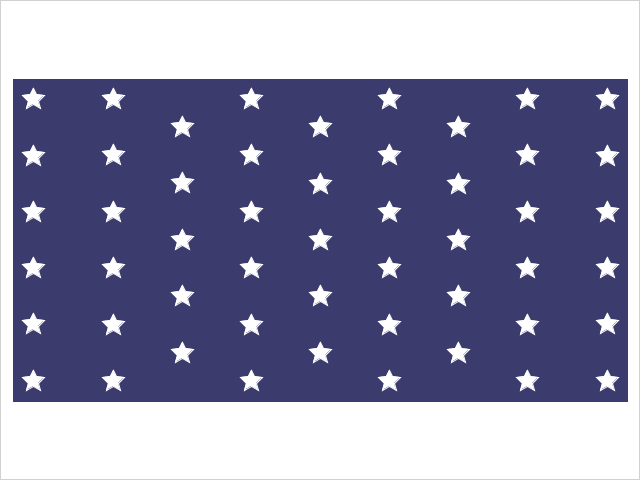
For comparison, here is the plot of the existing design (objective value 0.0103), where instead the diagonally adjacent stars are the closest:

Other Numbers of Stars
51 Stars
For each new state admitted to the union, a star is added and the new flag is introduced the next July 4th. Recent proposals to add either Puerto Rico or Washington, D.C. raise the prospect of a 51-star flag. Several researchers have looked for such arrangements among a handful of prespecified patterns. See, for example, this 2012 article in The American Mathematical Monthly. Instead, we have a general optimization model for stars, so we can change the value of
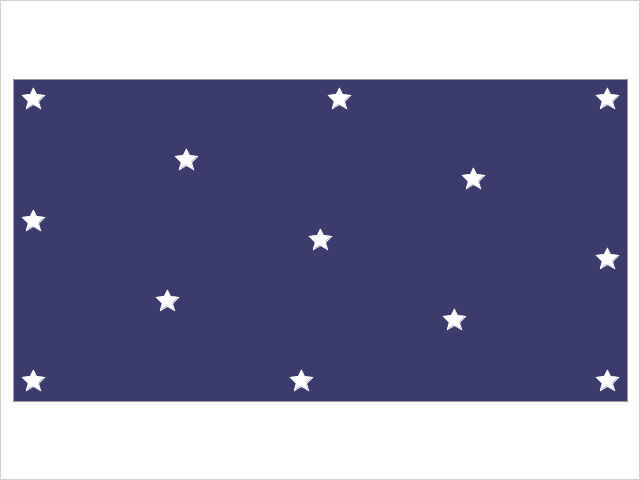
to 51 and rerun the code. Here is the resulting plot:
How do you like it in comparison with this popular design that has alternating rows of nine and eight stars?
13 Stars
The U.S. flag adopted on June 14, 1777 had 13 stars. Here's the optimized version:
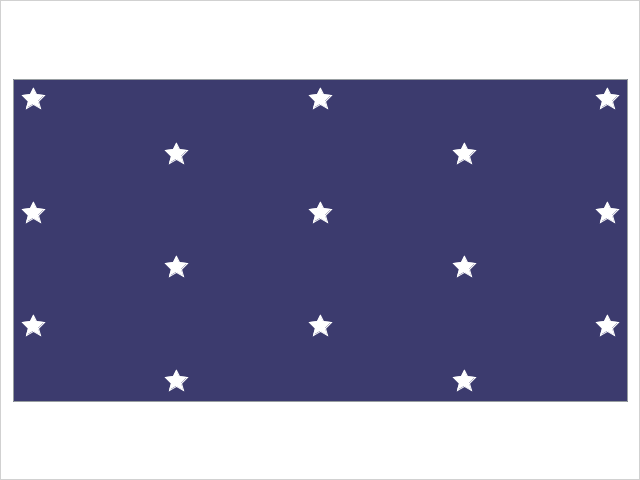
15 Stars
The Star Spangled Banner flag that inspired Francis Scott Key to write the U.S. national anthem had 15 stars. Here's the optimized version:
Facility Location
Although the problem discussed here was motivated by flag design, the same problem applies to facility location. Suppose you want to build a number of facilities within some prescribed region. If two facilities are too close to each other, they will cannibalize each other's business. So it makes sense to maximize the minimum distance between facilities.
For those in the United States, enjoy the holiday tomorrow!
9 Comments
As soon as I saw the title of this post "Fun with Flags" I thought of Sheldon Cooper 🙂 Great link to his fun with flags episodes. Nice optimization analysis and demonstration of SAS/OR!
Very interesting. However, your claim that the optimal design in this article "matches the existing design" is not correct. The US flag has nine rows that alternate 6, 5, ..., 6 stars per row. Your optimal design has 11 rows that alternate 5, 4, ..., 5 stars per row.
Thanks, Rick. I updated the text to read "transpose of the existing design" instead.
Ah, matches up to rotational symmetry. Got it!
Your objective incentivizes stars to be near the edges. Some people might think that is not a food criterion. I think the actual U.D. 50 star looks better than yours, due to stars not being as close to the edges.
You can account for the edge distances by including four families of constraints:
Maxmin <= X[i]^2, Maxmin <= (width - X[i])^2, Maxmin <= Y[i]^2, and Maxmin <= (height - Y[i])^2.
Very interesting analysis on the stars.
I was wondering how the OPTMODEL PROC works when we have large values of n.
There would probably be overlaps of stars if they are said to have a certain size.
I was also wondering about the size of each star to see for example how many non-overlapping stars we might have in the given dimensions.
This approach does not scale well with n because the number of constraints is O(n^2), and NLP solve time generally increases more than linearly with the number of constraints.
Pingback: "Are You The One?" Finding the matching through SAS Constraint Programming - Operations Research with SAS