Super Bowl 50 (L?) is this Sunday, so it's time for another (American) football-related post. Steven Miller, a mathematics professor at Rutgers University, recently noted that the 2015 NFL schedule allowed a competitive advantage for some teams (including the Carolina Panthers). This figure he generated displays the 2015 regular season as a graph:
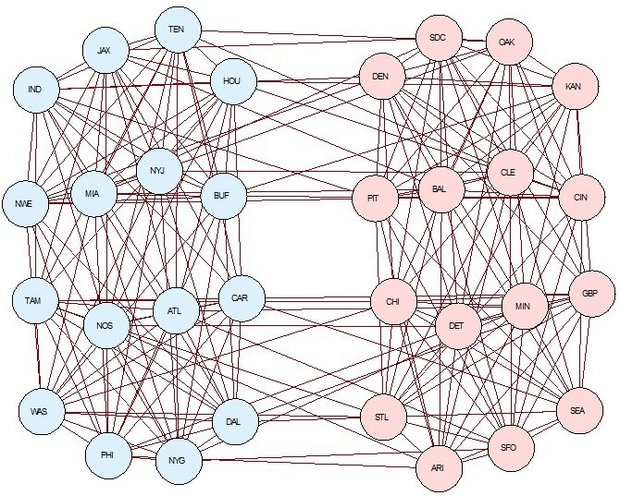
In the graph, each of the 32 NFL teams is represented by a node, and there is a link between two nodes if the two teams played each other in the regular season. Miller's layout shows that in 2015, the 32 teams can be partitioned into two sets that have only 32 links from one set to the other, and this number is abnormally low. The effect is that if one side contains a set of weaker teams, the other teams on that same side benefit by having weaker opponents. Usually, the scheduling is more diverse so that this situation does not happen.
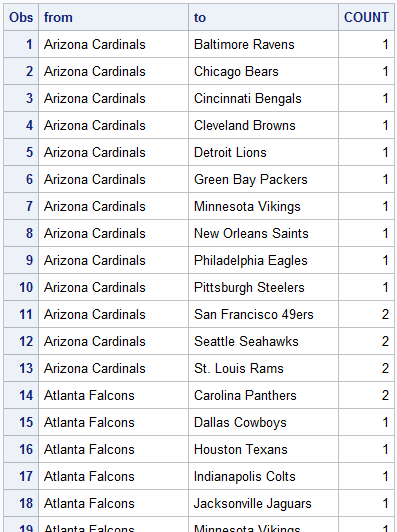
One way to look for this is to solve a minimum cut problem on the corresponding graph for each year. SAS/OR provides a minimum cut algorithm both in PROC OPTNET and in the network solver in PROC OPTMODEL. The required input data is just a set of links, each with a weight that represents the number of times that pair of teams played each other. The first several observations are shown here for 2015:
(By the way, this analysis does not depend on who won each game, so you can also look for this anomaly before the season even starts.) You can solve the minimum cut problem as follows:
proc optnet data_links=links2015 out_nodes=out2015; data_links_var weight=count; mincut; run; |
It turns out that the resulting minimum cut has value 16, but this cut is trivial in the sense that it has only one node on one side and the other 31 nodes on the other side. The links across the cut have total weight 16 because each team plays 16 games, and this same thing happens every year.
In order to detect what distinguishes the 2015 schedule from other years, you can solve a related problem: the balanced minimum cut problem, also known as the uniform graph 2-partition problem. The idea is to split the nodes into two disjoint sets, still minimizing the sum of weights of links that cross from one set to the other, but now you want the two sets to have the same number of nodes, in this case 16 nodes each. You can solve this problem by using the mixed integer linear programming (MILP) solver. The formulation involves two sets of binary decision variables:
The following PROC OPTMODEL statements read the data, formulate the problem, call the MILP solver for each year, and output the solutions:
proc optmodel; set <str,str> LINKS; num weight {LINKS}; set NODES = union {<i,j> in LINKS} {i,j}; /* IsLeft[i] = 1 if node i appears on left side of bipartition, 0 otherwise */ var IsLeft {NODES} binary; /* UseLink[i,j] = 1 if link <i,j> appears in cut (nodes i and j appear on opposite sides of bipartition), 0 otherwise */ var UseLink {LINKS} binary; /* minimize weight of cut */ min TotalWeight = sum {<i,j> in LINKS} weight[i,j] * UseLink[i,j]; /* if UseLink[i,j] = 1 then IsLeft[i] not equal IsLeft[j] */ con Cut1 {<i,j> in LINKS}: IsLeft[i] + IsLeft[j] >= UseLink[i,j]; con Cut2 {<i,j> in LINKS}: IsLeft[i] + IsLeft[j] <= 2 - UseLink[i,j]; /* if UseLink[i,j] = 0 then IsLeft[i] = IsLeft[j] */ con Cut3 {<i,j> in LINKS}: IsLeft[i] - IsLeft[j] >= -UseLink[i,j]; con Cut4 {<i,j> in LINKS}: IsLeft[i] - IsLeft[j] <= UseLink[i,j]; /* same number of nodes on each side of bipartition */ con Balanced: sum {i in NODES} IsLeft[i] = card(NODES)/2; /* solve for each year (concurrently) */ set YEARS = 2004..2015; num mincut {YEARS}; cofor {year in YEARS} do; put year=; read data ('links'||year) into LINKS=[from to] weight=count; solve; mincut[year] = TotalWeight.sol; print {<i,j> in LINKS: UseLink[i,j].sol > 0.5} weight; print IsLeft; end; print mincut; quit; |
Notice that, because the problems for different years are independent, you can use the COFOR statement to solve these problems concurrently, resulting in 4x speedup on my 4-core laptop. The syntax is nearly identical to the (serial) FOR statement, with just one keyword change.
The resulting output shows that, besides 2015, the 2012 schedule suffered from a similar anomaly:
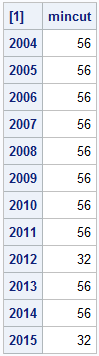
In most years, 56 of the 256 games were between teams on two different sides of the partition, but in 2012 and 2015, only 32 of the 256 games were. Miller notes that the scheduling patterns follow a 12-year cycle, so unless the NFL changes its plans, this same situation will occur again in 2024 and 2027.
Enjoy the game on Sunday (or the commercials, depending on your preference).
1 Comment
Below are the scheduling rules from the NFL website. This might help explain the 12 year cycle.
THE ANATOMY OF THE NFL SCHEDULE
Each NFL team plays 16 games over the 17-week season. The league uses a formula to determine all 256 matchups. The league’s 32 teams are split into two conferences — the American Football Conference (AFC) and the National Football Conference (NFC). The 16 teams in each conference are split into the East, North, South and West divisions; every division has four teams.
The NFL's scheduling formula ensures that all teams will play every team from every division in the other conference once every four years.
Here’s how each team’s opponents are set:
Every team plays six games against the other three teams in its division, facing off twice per season — once at home and once on the road.
Every team plays one game against each of the four teams from a division within its conference — two games at home and two on the road. Which division a team plays is determined by a rotation system ensuring that the teams in one division will play the teams in every other division in its conference once every three years.
Every team plays one game against each of the four teams from a division in the other conference once per season
— two games at home and two on the road. These matchups are also determined by a rotation, which ensures that all teams play every team from every division in the other conference once every four years.
Every team plays its remaining two games against teams from the two remaining divisions in its own conference
— one game at home and the other on the road. The matchups are determined by where the teams finished in their divisions in the previous season. For example, a team that finished the previous year in third place in its division will play the third-place teams from the two other divisions in its conference.