Restricted cubic splines are a powerful technique for modeling nonlinear relationships by using linear regression models. I have attended multiple SAS Global Forum presentations that show how to use restricted cubic splines in SAS regression procedures. However, the presenters have all used the %RCSPLINE macro (Frank Harrell, 1988) to generate a SAS data set that contains new variables for the spline basis functions. They then use those basis variables in a SAS regression procedure.
Since SAS 9.3, many SAS regression procedures provide a native implementation of restricted cubic splines by using the EFFECT statement in SAS. This article provides examples of using splines in regression models. Because some older procedures (such as PROC REG) do not support the EFFECT statement, the article also shows how to use SAS procedures to generate the spline basis, just like the %RCSPLINE macro does.
If you are not familiar with splines and knots, read the overview article "Understanding splines in the EFFECT statement." You can also read the documentation for the EFFECT statement, which includes an overview of spline effects as well as a brief description of restricted cubic splines, which are also called "natural cubic splines." I think the fact that the SAS documentation refers to the restricted cubic splines as "natural cubic splines" has prevented some practitioners from realizing that SAS supports restricted cubic splines.
Regression with restricted cubic splines in SAS

This section provides an example of using splines in PROC GLMSELECT to fit a GLM regression model. Because the functionality is contained in the EFFECT statement, the syntax is the same for other procedures. For example, if you have a binary response you can use the EFFECT statement in PROC LOGISTIC. If you a fitting a generalized linear model or a mixed model, you can use PROC GLIMMIX.
This example fits the MPG_CITY variable as a function of the WEIGHT variable for vehicles in the Sashelp.Cars data set. The data and a scatter plot smoother are shown in the adjacent graph. (To produce the graph, the following statements sort the data, but that is not required.) The smoother is based on a restricted spline basis with five knots. Notice that the SELECTION=NONE option in the MODEL statement turns off the variable selection features of PROC GLMSELECT, which makes the procedure fit one model just like PROC GLM.
/* create sample data; sort by independent variable for graphing */ proc sort data=sashelp.cars out=cars(keep=mpg_city weight model); by weight; run; /* Fit data by using restricted cubic splines. The EFFECT statement is supported by many procedures: GLIMMIX, GLMSELECT, LOGISTIC, PHREG, PLS, QUANTREG, ROBUSTREG, ... */ ods select ANOVA ParameterEstimates SplineKnots; proc glmselect data=cars; effect spl = spline(weight / details naturalcubic basis=tpf(noint) knotmethod=percentiles(5) ); model mpg_city = spl / selection=none; /* fit model by using spline effects */ output out=SplineOut predicted=Fit; /* output predicted values for graphing */ quit; title "Restricted Cubic Spline Regression"; proc sgplot data=SplineOut noautolegend; scatter x=weight y=mpg_city; series x=weight y=Fit / lineattrs=(thickness=3 color=red); run; |
The EFFECT statement with the SPLINE option is used to generate spline effects from the WEIGHT variable. The effects are assigned the collective name 'spl'. Putting 'spl' on the MODEL statement says "use the spline effects that I created." You can specify multiple EFFECT statements. Spline effects depend on three quantities: the kind of spline, the number of knots, and the placement of the knots.
- You specify restricted cubic splines by using the NATURALCUBIC BASIS=TPF(NOINT) options. Technically you do not need the NOINT suboption, but I recommend it because it makes the parameter estimates table simpler.
- The KNOTMETHOD= option enables you to specify the number and placement of knots. In this example, PERCENTILES(5) places knots at five evenly spaced percentiles of the explanatory variable, which are the 16.6th, 33.3th, 50th, 66.6th, and 83.3th percentiles. Equivalently, the knots are placed at the 1/6, 2/6, 3/6, 4/6, and 5/6 quantiles.
The number and placement of knots for splines
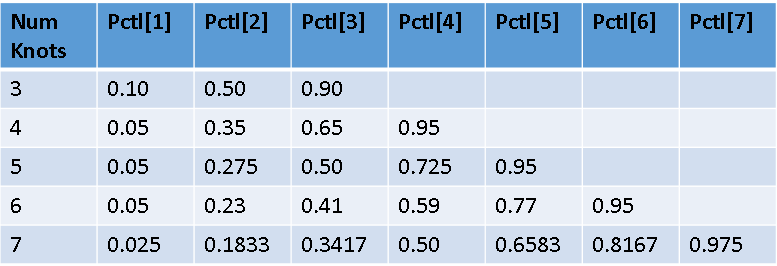
Most researchers use a small number of knots, often three to five. The exact location of knots is not usually critical: if you change the positions slightly the predicted values of the regression change only slightly. A common scheme is to place the knots at fixed percentiles of the data, as shown above. Alternatively, Harrell (Regression Modeling Strategies, 2010 and 2015) suggests heuristic percentiles as shown below, and this scheme seems to be popular among biostatisticians.
The KNOTMETHOD= option on the EFFECT statement provides several options for specifying the locations of knots. Try each of the following options and look at the "SplineKnots" table to see the positions of the knots:
- KNOTMETHOD=PERCENTILES(5): Places knots at the percentiles 1/6, 2/6, ..., 5/6. An example is shown above.
- KNOTMETHOD=EQUAL(5): Places knots evenly within the range of the data. If δ = (max-min)/6, then the knots are located at min + i δ for i=1, 2, ..., 5.
- KNOTMETHOD=RANGEFRACTIONS(0.05 0.275 0.50 0.725 0.95): If you want knots placed unevenly with the range of the data, use this option. For example, the value 0.05 means "place a knot 5% along the data range" and 0.275 means "place a knot 27.5% along the data range." You can separate list values by using spaces or commas.
- KNOTMETHOD=LIST(2513, 3174, 3474.5, 3903, 5000): This option enables you to list the locations (in data coordinates) of the knots. You can use this option to specify Harrell's schemes. For example, Harrell suggests the 5th, 27.5th, 50th, 72.5th, and 95th percentiles when you use five knots. You can use PROC UNIVARIATE to find these percentiles for the WEIGHT variable and then type the results into the KNOTMETHOD=LIST option.
- KNOTMETHOD=PERCENTILELIST(5 27.5 50 72.5 95): This option is available in SAS/STAT 15.1 (SAS 9.4M6). It enables you to place the knots at percentiles of the data. You can use this option to specify Harrell's schemes. For details, see "An easier way to perform regression with restricted cubic splines in SAS."
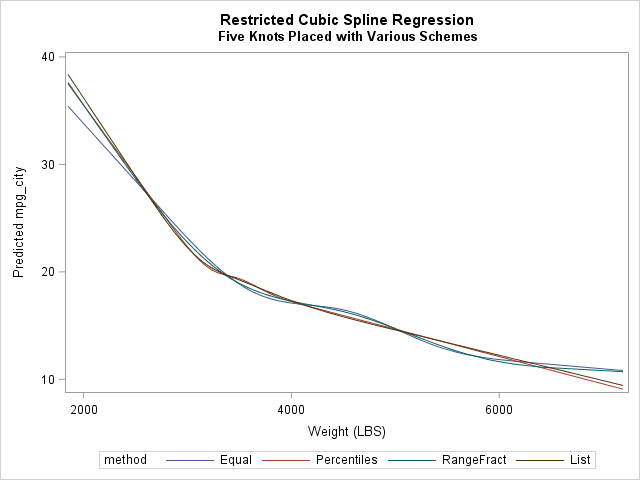
The adjacent graph shows the predicted values for the four different knot placement methods. (Click to enlarge.) You can see that the general shape of the regression curves is similar regardless of the placement of knots. The differences can be understood by looking at the placement of the first and last knots. The slope of the natural cubic spline fit is linear past the extreme knots, so the placement of the extreme knots dictate where the predictions become linear. For the EQUAL and RANGEFRACTION methods, the largest knots are placed at WEIGHT=6300 and WEIGHT=6923, respectively. Consequently, the predictions for large values of WEIGHT look more cubic than linear. In contrast, the largest knot for the PERCENTILES method is placed at 4175 and the largest LIST knot is 5000. The predictions past those values are linear.
Automate Harrell's knot placement suggestions
In SAS/STAT 15.1 (SAS 9.4M6), you can use the KNOTMETHOD=PERCENTILELIST(5 27.5 50 72.5 95) option to place knots at percentiles of the data, as recommended by Harrell.
If you have an earlier release of SAS, you can manually type in the values that correspond to the 5th, 27.5th, 50th, 72.5th, and 95th percentiles of the WEIGHT variable, as I did in the previous section. Alternatively, you can use PROC UNIVARIATE to write the percentile values to a SAS data set and then use a short DATA _NULL_ step to store those values into a macro variable. The macro variable can then be used as the argument to the KNOTMETHOD=LIST option, as follows:
proc univariate data=cars noprint; var weight; output out=percentiles pctlpts=5 27.5 50 72.5 95 pctlpre=p_; /* specify the percentiles */ run; data _null_; set percentiles; call symput('pctls',catx(',', of _numeric_)); /* put all values into a comma-separated list */ run; %put &=pctls; /* optional: display the list of values */ ... effect spl = spline(weight / ... knotmethod=list(&pctls) ); /* use the macro variable here */ ... |
PCTLS=2513,3174,3474.5,3903,5000 |
Write the spline basis functions to a SAS data set
As mentioned eaerlier, not every SAS procedure supports the EFFECT statement. However, the GLMSELECT, LOGISTIC, and GLIMMIX procedures all provide an OUTDESIGN= option, which enables you to output the design matrix that contains the spline basis functions. Furthermore, PROC LOGISTIC supports the OUTDESIGNONLY option and PROC GLIMMIX supports the NOFIT option so that the procedures do not fit the model but only output the design matrix.
You can use the variables in the design matrix to perform regression or other analyses. For example, the following example writes the restricted cubic basis functions to a data set, then uses PROC REG to fit the model:
/* create SplineBasis = data set that contains spline basis functions */ proc glmselect data=cars outdesign(addinputvars fullmodel)=SplineBasis; effect spl = spline(weight / naturalcubic basis=tpf(noint) knotmethod=percentiles(5)); model mpg_city = spl / selection=none; quit; /* use design variables in other procedures */ proc reg data=SplineBasis; model mpg_city = spl_:; output out=out p=p; run; |
Notice the options to the OUTDESIGN option in PROC GLMSELECT. The ADDINPUTVARS option copies the original variables into the design matrix. The FULLMODEL option tells the procedure to output the design matrix for all variables on the MODEL statement, regardless of whether they appear in the final "selected" model.
One last comment: the basis functions that are generated by the EFFECT statement are not equal to the basis functions created by the %RCSPLINE macro, but they are equivalent. The EFFECT statement uses the definition from The Elements of Statistical Learning (Hastie, Tibshirani, and Friedman, 2009, 2nd Ed, pp. 144-146). The %RCSPLINE macro implements scaled versions of the basis function. Thus parameter estimates will be different but the predicted values will be the same.
Summary
You can use the NATURALCUBIC BASIS=TPF(NOINT) option in the EFFECT statement in SAS to perform regression with restricted cubic splines, which are also called natural cubic splines. You can use the KNOTMETHOD= option to specify the number and placement of the knots. The EFFECT statement is supported by the GLMSELECT, LOGISTIC, and GLIMMIX procedures, among others. These procedures enable you to output a design matrix that contains the spline basis functions, which you can use in procedures that do not support the EFFECT statement.
This article was inspired by several talks that I heard at SAS Global Forum. For more information on this topic, see the following:
- Bilenas, J. V. (2014), "Scatter Plot smoothing using PROC LOESS and Restricted Cubic Splines."
- Croxford, R. (2016), "Restricted Cubic Spline Regression: A Brief Introduction."

50 Comments
I know that spline/GAM models have greater fit with more complex interpretation. I just applied the above code to a project I was planning to fit a spline model to today (so this was a nice timely article). The functional relationship between my DV and IV appears to be an "U" shape where I used three knots based on 0.1, 0.5, 0.9. I am happy with the fit (knots at subject ages 5, 17, 29) and it makes contextual sense as well. Though I wanted to see if you had information on the model's coefficients. So the model has an intercept term, spl 1 and spl2. In my mind it seemed like there should be #knots + 1 for the number of spl terms generated? What do the two spl terms represent in a 3 knot model (just the two general slopes in a U-shape? Thank you.
Great question. The BASIS=TPF(NOINT) option is suppressing one of the (redundant) basis elements. When you ask for a spline basis with k knots (see this doc example), you get k basis functions: the constant function, the identity function, and k-2 truncated cubic power functions. In your three-knot basis, the intercept is one parameter estimate, the spl_1 function is the identity function (age), and spl_2 is a function that is constant for age29. The parameter estimates tell you that the predicted value is YHat = Intercept + b1*age + b2*slp_2. It is usually difficult to "interpret" the parameters for a spline model.
Rick,
If I have many variables, how do I know which one has linear effect and which one has non-linear effect ?
That's a hard question, especially if there are interactions. One option is to use PROC GLMSELECT on the spline basis variables. If the variable selection process keeps spl_1 (=the original variable) but not the higher spline variables (the truncated power basis functions), then that indicates that the nonlinear effects are small. Use the SPLIT option to split the spline effects, like this: EFFECT spl = SPLINE(weight / SPLIT);
Hello Rick, Do you have any example (ad code) to share, please?
Yes, several. Use your favorite search engine to see other examples of generating a design matrix by using PROC GLMSELECT and then using the design columns in a subsequent regression analysis. A possible search term is
"proc glmselect" outdesign site:blogs.sas.com/content/iml
Is there an option to output confidence intervals along with the FIT values?
Yes, but there is no special "spline CI option." The spline effects are just like any other explanatory variables, so you can use whatever options the procedure supplies on the OUTPUT statement. For PROC REG you would use the LCLM and UCLM options. For GENMOD, the options are named LOWER and UPPER. For GLIMMIX, LCL and UCL, and so forth.
Thank you for this very helpful page!
I have used the EFFECT statement together with PROC LOGISTIC. But I haven't figured out how to modify the code in order to plot odds ratios on the y axis, instead of logit or predicted values. Is it possible to do that?
Look at the ODDSRATIO statement. See the example in the article "Odds ratio plots with a logarithmic scale in SAS." If that doesn't meet your needs, post your question and sample data to the SAS Support Communities.
Hi Rick,
Thank you very much for you very helpful and informative article on restricted cubic spline.
I was just wondering if you could help me with interpreting the results from PROC GLMSELECT. See below for my results. I'm not sure if the parameter estimates for SPL 1 through SPL 4 are the slopes for the 4 or the last three are the differences in slopes? Thank you for your help! Tien
Parameter Estimates
Parameter DF Estimate Standard Error t Value Pr > |t|
Intercept 1 13033 518.310417 25.15 <.0001
spl 1 1 21.548739 38.548243 0.56 0.5762
spl 2 1 23.229208 9.179597 2.53 0.0115
spl 3 1 -108.150319 35.829167 -3.02 0.0026
spl 4 1 128.501850 44.262719 2.90 0.0037
Splines are not as straightforward to interpret as linear variables. The estimates say that your model is
Y_hat = 13033 + 21.5*spl1 + 23.2*spl2 -108*spl3 + 128.5*spl4
where spl1-spl4 are the basis functions. FOr more information, see the article "Visualize a regression with splines."
Hi, Rick
Could you please tell how to edit the following codes to use proc logistic to create the exactly the same restricted cubic spline. Thanks
proc glmselect data=cars outdesign(addinputvars fullmodel)=SplineBasis;
effect spl = spline(weight / naturalcubic basis=tpf(noint) knotmethod=percentiles(5));
model mpg_city = spl / selection=none;
quit;
I'm a little confused by your question. The SplineBasis data set that is created by PROC GLMSELECT contains the variables for the spline basis, so you can use that data as input for any procedure in SAS. You don't have to use the OUTDESIGN= option or the EFFECT statement for other procedures. However, to answer your questions, the following example uses PROC LOGISTIC to generate a spline basis for a binary response:
Thank you for this very informative article. I'm a starter on RCS and planning to do an RCS analysis in proc PHreg on a very large data. I've looked over multiple SAS macros designed for RCS, but this built-in method is the most convenient ever seen. However, I have 2 questions on this method:
1. I've already constructed a rather complicated Cox model, including time-varying variables created both by counting process method and statement method. However, I only focus on the linearity issue of one specific Variable, age, while adjusting for the rest. Age is defined as a binary time-dependent variable with a cutoff of 400days (in my model the HR of age differs greatly before and after 400days of follow-up), and included in the model as age_lt400 and age_ge400 (both created in prior data step using counting process method). As suggested, I should include two EFFECT statements for age. Is it ok for me to do that? And additionally only for my interest, is it possible to include a RCS analysis for an interaction term of continuous time with one of my Var?
2. I notice you haven't talked about the way to test for linearity. Is it right to perform the test by a test statement which includes the terms spl2-spl4 (5 knots)?
Thank you very much!
Thanks for writing and good luck on your project. I am not an expert on Cox regression models, so I suggest you ask your questions at the SAS Support Community for statistical procedures.
I don't fully understand what you are asking, but it sounds like you have two indicator variables AGE_LT400 and AGE_GE400. From your description, I would say
(1) You cannot include both variables in your model. They are linearly dependent: AGE_LE400 = 1 - AGE_GE400.
(2) You should not compute a spline of a categorical variable. Splines are for continuous variables.
(3) I don't think using a spline effect on a TEST statement makes sense.
When you post to the Support Community, you can discuss these issues with people who know more about survival analysis.
Dear Dr. Rick,
I followed your code to generate cubic splines, thank you. I have some doubts, is it possible to graph the estimators obtained instead of the predictive values?
How can I use the "nomarkers" in the sgplot?, I have some many markers and I don't want it.
Thanks.
Monica
Hi Monica,
Thanks for your comment. I suggest that you post your question and sample data to the SAS Support Community for statistical procedures. That way you can easily include code and sample data.
If you are asking about how to graph the spline basic functions, they are in the SplineBasis data set. For the example in the post, you can graph the basis functions as follows:
See also the article Visualize a regression with splines."
Yes, I was asking about how to graph the spline functions, and its seem easy, thanks. Just one more question, do I have to keep the spline functions? if yes, how can I do it?
When I run the code, spl1-spl4 variables were not found. (Error: "Variable SPL1 not found")
Below the code that I am using:
ods select ANOVA ParameterEstimates SplineKnots;
proc glmselect data=0811dersesdiet;
effect spl = spline(lactationbypar / details naturalcubic basis=tpf(noint)
knotmethod=percentiles(5) );
model weightchange = spl; /* fit model by using spline effects */
quit;
title "Restricted Cubic Spline Regression";
proc sgplot data=0811dersesdiet noautolegend;
series x=lactationbypar y=spl1;
series x=lactationbypar y=spl2;
series x=lactationbypar y=spl3;
series x=lactationbypar y=spl4;
run;
Thank you for your time!
As I said before, please post your coding questions to a SAS Support Community, which is better suited for posting SAS code. You have mistyped the variable names, which should be spl_1-spl_4, as shown in my initial response.
HI
I have data with repeated measurements (patient outcomes at a hospital are not independent of each other).
I know of the option to use REPEATED statement in proc genmod, or proc nlmix.
Is there something like this for the proc gam procedure?
Thanks
To fit generalized additive models in SAS, use the newer GAMPL procedure rather than the older PROC GAM. To answer your question: no, the nonparametric regression procedures in SAS do not have a REPEATED statement. You specify the spline effect in the EFFECT statement and/or the MODEL statement.
Dear Dr.Rick,
I am trying to use your code in a back-fitting algorithm. I need to save the spl from iteration(i) to use in iteration (i+1). How can I do that?
Thanks,
Fatemeh
This question is more complicated than I can easily answer in a comment. Please post sample data and your current code to a SAS Support Community. Provide as many details as you can, including how you are implementing the algorithm. If you are using SAS/IML, post to the SAS/IML Support Community. Otherwise, post to the Statistical Procedures Community.
Hi,
Thanks for the clear explanation. It would be nice if the dataset created with OUTDESIGN included an identification variable. For example, variables listed in the ID statement in PROC LOGISTIC. I know the dataset is sorted in the same order as the input dataset, I just don't feel comfortable doing a MERGE without a BY statement.
Daniel
As shown in the last example, you can use the ADDINPUTVARS suboption to the OUTDESIGN= option to get an ID variable into the output data set. For example, the 'SplineBasis' data set in the last example contains the 'Model' variable, which you can use as an ID variable.
By the way, in case you need it, there is a macro variable that contains "Meaningful names for columns of a design matrix."
A bit late to the party but I don't think proc logistic allows for suboptions in the outdesign option.
Sorry if you were confused. When I said "as shown in the last example," I meant the last example in the article, which uses PROC GLMSELECT.
Dear Dr. Rick,
I followed your code to generate cubic splines, thank you.
I have data with repeated height measurements of children, I want to (1) fit splines to see how height changed over age within each group (access to water vs. having a problem in using water), and (2) compare the trend of height change, how to analysis it in SAS?
In addition, I want to draw a curve of one group of height over age, but I didn't get a smooth curve, could you help me find the problem? The code is below:
proc glimmix data=Ss;
effect spl = spline(age / details naturalcubic basis=tpf(noint)
knotmethod=list(&pctls) );
class IDind;
model HEIGHT = spl/solution; /* fit model by using spline effects */
random int/subject=IDind type=un;
output out=SplineOut predicted=Fit; /* output predicted values for graphing */
quit;
title "Restricted Cubic Spline Regression";
ODS GRAPHICS /ANTIALIASMAX=80000;
proc sgplot data=SplineOut noautolegend;
scatter x=age y=HEIGHT;
series x=age y=Fit / lineattrs=(thickness=3 color=red);
run;
Thanks
Please post questions like this to the SAS Support Communities. The general problem that you are experiencing is explained in the article "Visualize multivariate regression models by slicing continuous variables." For your mixed model, the OUTPUT statement is including the random effect in the predicted values. Use the PREDICTED(NOBLUP) option and sort the output data to get the plot you want.
Pingback: An easier way to perform regression with restricted cubic splines in SAS - The DO Loop
Dear Dr. Rick,
Thank you for your code, I have a near 0.5 million subjects in a cross sectional study. I observed a u shaped relationship between exposure and outcome using restricted cubic splines with 4 knots,I am happy with the results, but my question is how can I to identified the exact cut point where the outcome is minimum . Is it suitable to use boostrap analysis ? What's your suggestion?
I am appreciated for your reply!
Thanks
Read the article "Compute derivatives for nonparametric regression models." The article describes how to find the extrema of a nonparametric regression function, which occurs when the derivative of the predicted response is zero. You can use the ideas in the article to find the values of the explanatory variables that correspond to the minimum predicted value.
Great blog! I used proc logistic to create spline basis functions that I can use and re-use as predictors in proc genselect just like any other data transformation.
But now I want to use splines for cyclic variables, like time-of-day (coded as military hour 0,1,2,3, ...23.) In addition to wanting the results to be continuous and smooth at the interior knots, I want it also be continuous and smooth where the left outer knot joins the right outer knot. (e.g. where the last hour of the day joins the first hour of the next day. Likewise for day-of-week and monthly seasonality. What do you suggest?
For a univariate smoother, I've written about how to use PROC LOESS to fit a period smoother to 2D data. For explanatory variables, I advise that you not use cubic splines but use a periodic spline basis, such as a Fourier basis. If t is a periodic variable with period P, the basis elements are
cos(2*pi*w*t / P) and sin(2*pi*w*t / P) for w = 0, +/-1, +/-2, ....
This is the natural basis for periodic signals and is used extensively in signal processing.
Dear Dr. Rick Wicklin
Thanks very much for your code. I used the spline effect function in the cox model. Your code works very well.
I am wondering how I can get the p-value for nonlinearity. Does the P-value for the spline variable indicate the P-value for nonlineary?
Truly appreciate your reply.
This is a complex question that is not easy to answer. When you use spline effects, you are fitting a LINEAR model (in the parameters) but are using a spline basis to model nonlinear relationships between the DV and the IVs. It is not clear to me what hypothesis you want to test. You might want to discuss your model with colleagues or post your question to a statistic forum such as CrossValidated.
Dear Dr. Rick Wicklin
Thanks for your reply. We hypothesized that there would be a nonlinear association and the shape of the association from the spline also seems like that. Actually, before using the cubic spline model, we also tested the square term and square root term of the exposure variable. We found these two terms were statistically significant.
But we need a p-value for nonlinearly to present. I read that a lot of papers using the %RCSPLINE macro reported a p-value for non-linearity.
So we are trying to figure out if there is a way any p-value for nonlinearly estimated in the spline effect function.
I think you might be talking about tests for linearity, as described on Frank Harrell's web page for his spline macros. If you use the OUTDESIGN= option to write the spline bases to a data set and then include those variables in a model, you can use standard SAS statements (such as the TEST statement) to test whether the coefficients of the spline variables are all zero.
Hello Dr Rick,
Thanks for citing my presentation on your blog site. I have been using linear and restricted cubic splines for 15 years in the banking credit industry. One reason I use the RSCPLINE MACRO is to get the functional form of the spline transformations to pass off to the Implementation Department to score new data. One can use the STORE statement in PROC GLMSELECT to create the model store and then do post fitting using PROC PLM to score new data. However, the Production Implementation Department may not use SAS to implement these models. More typically, with large data in banking and many models to score, the production team prefer to score many models in a single pass of the data as opposed to runing PROC PLM against the data many times.
Thanks again for the citation,
Jonas Bilenas
Pingback: Visualize a regression with splines - The DO Loop
Hello Dr. Rick,
I was wondering how to get the coefficients that form the polynomial function for the spline, before and after the knot, to derive the predicted values?
You can ask for programming help by posting your program and data to the SAS Support Communities. For spline-related questions, I suggest the Statistical Community.
Dear Dr. Rick,
Thank you for your code and clear explanation. I am trying to use your code in PROC LOGISTIC, but I don't know how to add other variables to adjusted (like gender, education...) .
In the last example, we can used ADDINPUTVARS in GLMSELECT and output the SPL_ variables to PROC REG, but I can't find the similar option in PROC LOGISTIC statement (I need to add other variables).
Is there any other way to solve it? I am appreciated for your reply!
As I say in the article PROC LOGISTIC supports the EFFECT statement, so you can create the splines directly in the grammar of the procedure. For example:
Hi Dr. Wicklin,
Can the EFFECT statement be used to perform restricted quadratic regression? I could not find this use from my reading of the SAS manual.
Best,
Hongjie
You can ask questions, discuss programs, and share data at the SAS Support Communities. By definition, a restricted quadratic model is a quadratic model that has restrictions on the parameters. So, no, I would not use an EFFECT statement for restricted quadratic regression. If you have linear restrictions, you can use PROC REG or PROC NLIN (see this article). For nonlinear constraints, I would use optimization in PROC IML or PROC OPTMODEL.
I will do. Thank you for such a quick reply!
Dear Dr. Rick,
I am now preforming a logistic regression to estimate propensity score. I have several continuous variables in my predictors and I want to use restricted cubic spline for them in my regression model.
When I wanted manually type in the values that correspond to the 5th, 27.5th, 50th, 72.5th, and 95th percentiles of the test_ecg variable(which means numbers of Electrocardiograms test patient had in previous year), it come out with same value in different percentiles (the output is "0, 0, 3, 7,15").
Then I put this cutpoint into my logistic model with EFFECT statement, the error occurred (log says there can't not be same value for spline), so I am wondering how should I do for this variable.
follow is my coding for information
/*test_ecg*/
proc univariate data=cov.co5_1 noprint;
var test_ecg;
output out=percentiles_test_ecg pctlpts=5 27.5 50 72.5 95 pctlpre=p_; /* specify the percentiles */
run;
data _null_;
set percentiles_test_ecg;
call symput('pctls_test_ecg',catx(',', of _numeric_)); /* put all values into a comma-separated list */
run;
%put &=pctls_test_ecg;
best,
Hank
For SAS programming questions, please post your question to the SAS Support Communities.