This week Hillary Clinton became the first woman to be nominated for president of the US by a major political party. Although this is a first for the US, many other countries have already passed this milestone. In fact, 60 countries have already elected women as presidents and prime ministers. For example, the UK was previously led by Margaret Thatcher (1979–1990) and is currently led by Theresa May.
The CNN web site published a list of the 60 countries that have been led by a woman president or prime minister. The list is long and requires that you scroll up and down to compare different countries. To help visualize the data, I decided to turn that list into a graphic. You can download the SAS program that contains the data and creates a graph of female world leaders.
I wanted the graph to show the first year that each country elected a female leader. Consequently, countries like Norway and the UK only appear once on the list even though they have been led by women multiple times.
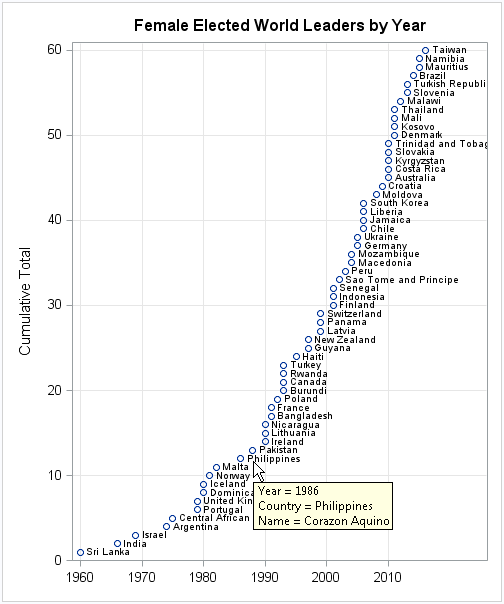
I thought about several different graph types, but finally settled on the scatter plot to the left (click to enlarge). The graph shows the cumulative number of countries that have elected a female president or prime minister.
The vertical axis shows the rank of each country on the list, which makes it easy to find which country was first (Sri Lanka in 1960), second (India), third (Israel), and so forth. The tenth country was Norway. The fiftieth country was Denmark.
You can also easily find out which countries elected their first female leader in a particular year, since that information is plotted on the horizontal axis. However, the graph is not so good at finding a particular country unless you know the approximate election year. Can you find Peru?
If you create the HTML version of this graph in SAS, the graph contains tool tips so that you can hover the mouse over a country's name and find out the name of the woman who was elected. The graph on this page shows that Corazon Aquino was the first female president of the Philippines.
The graph shows that the 1990s was a breakout decade in which many countries elected their first female leader. This trend is better shown by using a bar graph that augments the previous information. The bar graph shows that about 15 countries were added to the list during each of the last three decades.
How many countries have elected a female leader? Who was first? #DataViz Click To Tweet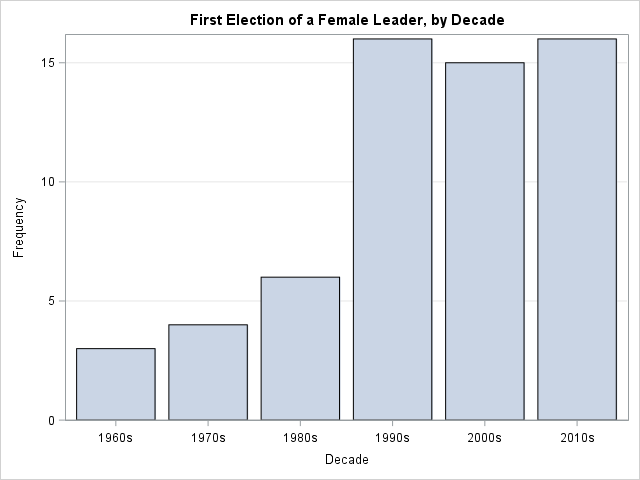
Although countries did not elect female leaders until the 1960s, female rulers are not new to the world. Monarchs such as Nefertiti, Queen Elizabeth I, and Catherine the Great are some famous world leaders from previous centuries. Some women were so influential that they have epochs named after them, such as the Elizabethan era and the Victorian era.
There are still three years left in the 2010s, so the current decade is likely to be the decade in which the most countries elected a woman for the first time. Which country will be number 61 on the list? Time will tell.

1 Comment
Rick,
It would be look better if you include country name into Histogram.
So you are going to vote for Hillary ?