When using SAS to format a number as a percentage, there is a little trick that you need to remember: the width of the formatted value must include room for the decimal point, the percent sign, and the possibility of two parentheses that indicate negative values. The field width must include room for the parentheses even if the number that you are formatting is strictly positive!
The PERCENTw.d format
The PERCENTw.d format takes a proportion and displays it as a percentage. For example, 0.123 gets displayed as 12.3%. Negative values are displayed by enclosing them in parentheses, so -0.123 is displayed as (12.3%). Thus for proportions in the range (-1, 1), you need to allow at least six spaces: one each for the decimal point and percent sign, and two each for the number and the parentheses. This leads to the following heuristic:
For the PERCENTw.d format, the field width should be at least 6 more than the number of decimal places that you want to display.In other words, for the PERCENTw.d format, a good rule of thumb is to set w = d + 6. Smaller field widths will either steal space from the decimal width or display the value as "*%", which means "unable to display this value by using the current field width."
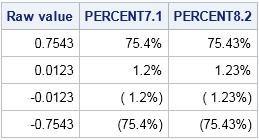
My favorite formats are PERCENT7.1 and PERCENT8.2. An exception to the above heuristic is that I sometimes use PERCENT5.0 for variables that appear along the axis of a graph; you can use 5 for the field width because there is no decimal point to display. The following SAS DATA step displays several positive and negative proportions in the PERCENT7.1 and PERCENT8.2 formats:
data Percent; format x BEST8. p1 PERCENT7.1 p2 PERCENT8.2; label x = "Raw value" p1 = "PERCENT7.1" p2 = "PERCENT8.2"; input x @@; p1 = x; p2 = x; datalines; 0.7543 0.0123 -0.0123 -0.7543 ; proc print data=Percent noobs label; run; |
If you have values that are greater than 1, you will need to increase the field width, since these will be displayed as 150% (1.5) or 2500% (25).
The PERCENTNw.d format
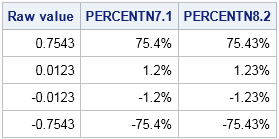
Not every SAS programmer knows about the PERCENTNw.d format. Notice the extra 'N' in the name, which stands for 'negative.' This format is similar to the PERCENTw.d format except that negative values are displayed by using a negative sign, rather than parentheses.
For many applications, I prefer the PERCENTNw.d format because of the way that it handles negative values. The heuristic for specifying the field width is the same as for the PERCENTw.d format. This might be surprise you. Since the PERCENTNw.d format uses a negative sign instead of parentheses, shouldn't you be able to specify a smaller field width?
No. For ease of converting between the PERCENTw.d and PERCENTNw.d formats, the rules are the same. The documentation for the PERCENTNw.d format states that "the width of the output field must account for the minus sign (–), the percent sign (%), and a trailing blank [emphasis added], whether the number is negative or positive."
You can modify the previous DATA step to display the same raw values by using the PERCENTNw.d format. The results follow:
In summary, remember to pad the field width for these formats by including space for the decimal point, the percent sign, and the possible negative sign or parentheses. You must do this even if your values are positive.
This blog post was inspired by an exchange on the SAS-L discussion forum. If you are new to Base SAS programming, The "L" is a good place to lurk-and-learn or to ask questions. I also recommend the SAS Support Communities for learning SAS software and related topics such as statistics, data mining, and matrix computations.

12 Comments
Hi Rick.
Great advice. The rule I use for PERCENTw.d is to add 3 to the desired numerical precision which must include a decimal point. In this way, I don't run into problems with percentage values exceeding 100 which do occur in some scenarios. For example, if I know that the possible range of percentage values is (500.00%) through 500.00%, I use PERCENT9.2, calculated as 6 positions for digits and decimal point, plus 3 positions for % sign and parentheses.
Cheers,
Peter
I'm curious why SAS doesn't have a built in format for displaying percentages that are 100 based (so numbers from 0-100 displayed as "100%" etc... PROC FREQ and such give you percentage values that are 0-100 based in their datasets, not 0-1 based, and you have to use a custom format for them, annoyingly.
I have not been able to get this to work. My code accepts 'percent6.', but not 'percentn7.' or 'percentn10.' I get the message 'ERROR 48-59: The informat PERCENTN was not found or could not be loaded.'.
Your ERROR message says you are trying to use the PERCENTN INFORMAT. There is no informat by that name. This article is about using the PERCENTNw.d format.
Wow that PERCENTN format saves my life. Thanks you Rick.
Why isn't there a PERCENTPN format that extends the idea of PERCENTN to positive values as well?
I mean, a format that ALWAYS shows the sign before the number, like this for PERCENTPN10.2:
+9.23%
-2.43%
as contrast to PERCENTN10.2:
9.23%
-2.43%
SAS provides PROC FORMAT so that users can define their custom formats. There have been dozens of conference papers and books written on the topic. If you need help, you can post your question to the SAS Support Community.
The issue that I have is that even if I use the format w.1 I still get 2 decimal places when I have a single digit percentage.
The examples in this blog post show that the PERCENT7.1 format displays one decimal place, not two. If you are having programming problems, you can post your data, code, and question at communities.sas.com.
Hello Rick,
I read this about 'percent' and 'percentn' formats (from 2015! some years ago) and... do you know if something like 'percentx' exists?
Becasuse I'm trying to write a comma as decimal delimiter.
The current version of the SAS documentation shows only PERCENT and PERCENTN formats.
Pingback: Using colors to visualize groups in a bar chart in SAS - The DO Loop