While walking in the woods, a statistician named Goldilocks wanders into a cottage and discovers three bears. The bears, being hungry, threaten to eat the young lady, but Goldilocks begs them to give her a chance to win her freedom.
The bears agree. While Mama Bear and Papa Bear block Goldilocks' view, Baby Bear tosses a coin 30 times and records the results. He then makes up two other (fake) sequences of heads and tails, and gives Goldilocks a piece of paper that shows all three sequences. Papa Bear growls, "If you can determine which sequence came from the real coin toss, we will let you go. Otherwise we will eat you for dinner, for I have grown tired of porridge."
Here are the three sequences of heads (H) and tails (T) that the bears present to Goldilocks. Each of the sequences contain 16 heads and 14 tails.
- H H H H H H H H H H H H H H H H T T T T T T T T T T T T T T
- H T H T H T H T H T H T H T H T H T H T H T H T H T H T H H
- H T T H H H T T T T T T T H H H T H T H H H T H H H T H T H
Goldilocks studies the three sequences and tells Papa Bear:
The first sequence is "too hot." It contains 16 heads followed by 14 tails. I would not expect such long sequences of heads and tails. Similarly, the second sequence is "too cold." It alternates between heads and tails like clockwork. The third sequence is "just right." It matches my intuitive notion of a random sequence of two categories: many short subsequences interlaced with a few longer subsequences. I think that the third sequence is real.
She had chosen correctly. The three bears, impressed by her statistical knowledge, set Goldilocks free and—once again—reluctantly ate porridge for dinner.
Is a sequence of heads and tails random? Implement the Runs Test in #SAS Click To TweetImplement the "runs test" in SAS
Goldilocks reasoned well. If she had brought along her laptop with SAS software on it, she could have used statistics to analyze the data.
You can quantify Goldilocks' intuitive notions by defining a run as a sequence of consecutive trials that result in the same value. The first sequence has two runs: a run of heads followed by a run of tails. The second sequence has 29 runs. The third sequence has 15 runs: eight runs of heads and seven runs of tails.
It turns out that you can calculate the expected number of runs in a random sequence that has n heads and m tails. The expected number of runs is E(R) = 2nm / (n+m) + 1. The three sequences have n=16 heads and m=14 tails, so the expected number of runs is 15.9. So Goldilocks' intuition was correct: the first sequence does not have enough runs, whereas the second has too many. The third sequence has 15 runs, which is close to the expected value.
You can use these facts to construct a statistical test for the randomness of a two-category sequence, based on the number of runs in the sequence. This is called the runs test, or the Wald-Wolfowitz test for randomness. There is a SAS Knowledge Base article that describes how to implement the runs test in SAS by using the DATA step. However, the DATA step implementation is longer and more complicated than an analogous implementation in the SAS/IML language.
To simplify counting the number of runs, recode the two categories (heads and tails) as –1 and +1. Then a "run" is a sequence of consecutive values that have the same sign. I have previously blogged about how to use the DIF-SIGN technique to detect when terms in a sequence switch signs. In the following program, that technique is used to count the number of runs in a sequence.
proc iml;
/* Implement the Wald-Wolfowitz test (or "runs test").
   The SEQ vector is assumed to contain two groups (char or numeric).
   Compare with Base SAS version: http://support.sas.com/kb/33/092.html */
start RunsTest(seq);
   u = unique(seq);                /* find unique values (should be two) */
   d = j(nrow(seq)*ncol(seq),1, 1);/* recode as vector of -1, +1 */
   d[loc(seq=u[1])] = -1;
   n = sum(d>0);                   /* count number of +1s */
   m = sum(d<0);                   /* count number of -1s */

   /* Use DIF-SIGN trick to count the number of runs */
   dif = dif(sign(d));             /* difference in signs */
   dif[1] = choose(d[1]<0, -2, 2); /* replace first obs */
   R = sum(dif=2 | dif=-2);        /* R = observed number of runs */

   mu = 2*n*m / (n+m) + 1;         /* E(R)=expected number of runs, given n, m */
   var = 2*n*m*(2*n*m-(n+m)) / ((n+m)##2*(n+m-1)); /* var(R) */
   sigma = sqrt(var);              /* StdDev(R) */

   /* R is asymptotically normally distributed. Compute test statistic. */
   if (n+m)>50 then      Z = (R-mu)    /sigma;
   else if R-mu < 0 then Z = (R-mu+0.5)/sigma; /* for small samples, apply */
   else                  Z = (R-mu-0.5)/sigma; /*    continuity correction */

   return(Z || 2*(1-cdf("Normal", abs(Z))));   /* (Z, two-sided p-value) */
finish;

flips = {H T T H H H T T T T T T T H H H T H T H H H T H H H T H T H}`;
Test = RunsTest(flips);
print Test[c={"Runs Statistic" "p-value"} L="Runs Test, two-sided"]; |
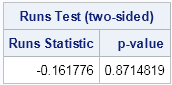
The output of the RunsTest module is a two-element vector. The first element is the test statistic and the second element is the two-side p-value. Running the test on Baby Bear's coin-toss sequence produces a large p-value, which means that Goldilocks would accept the null hypothesis that the sequence of coin tosses is random. You can run the test for the other two sequences ("too hot" and "too cold") and see that both of them produce tiny p-values. If Goldilocks had implemented the runs test, she would have concluded that the made-up sequences are unlikely to be random sequence of coin flips.
I'll conclude with a few thoughts:
- The SAS/IML language is useful for implementing statistical methods, such as the runs test, that are not included in any SAS procedure.
- The SAS/IML language is compact. For this example, the SAS/IML program contains about 15 lines, versus 65 lines for the DATA step code.
- When I first thought about this problem, I thought I would need to use a loop to count the number of runs in a sequence. However, by recoding the data as +/–1, I was able to vectorize the computation by using the DIF-SIGN technique.
- Goldilocks was fortunate to know statistics.

17 Comments
Fortunately for Goldilocks, she was refreshed during her nap on the "just right" bed. No doubt she was at the top of her mental game when faced with this puzzle.
Is there an epilogue where she becomes a YouTube sensation with videos of talking, reasoning bears?
There is an epilogue, which I will post on Friday, but I doubt it will become an internet sensation.
Fortunate indeed that Goldilocks knows statistics - it's a great year for it to be revealed. I'm interested to know all the other untold stories you may know now... Cinderella and fuzzy merge for her shoe? ;-)
Interesting post. I am curious as to whether you think passing the runs test is good evidence for the randomness of the sequence in question, as opposed to merely failing to reject randomness. The issue might be inadequate power. But it would be good to know if it's reasonable to infer approx. randomness on the basis of passing this non-parameteric test. Thanks.
You've hit on the crux of the matter: When can we conclude that a sequence is random? No, passing the runs test does not enable us to conclusively say that a sequnce is random, but it is evidence. There are other tests for randomness (for example, the length of the langest run and the distribution of the run lengths) that could add further evidence. And, of course, if you have a long sample, then the evidence is stronger than if you have a short sample. Just as a jury must weigh pieces of evidence in order to decide a defendant's guilt, so must the statistician must weigh the evidence and decide when the evidence is "beyond a reasonable doubt."
Pingback: Random Sequence of Heads and Tails: For R Users | Statistical Research
Pingback: Two applications of the “runs test” - The DO Loop
I have binary survey data (sang or silent) for multiple male birds for surveys 30-120 minutes long. I am trying to show whether the sample data is random or not (do they sing in bouts) but am not sure how to modify your code to deal with my data. Any advice?
I suggest you post your question and sample data to the SAS Statistic Support Community.
I do simulate different number of samples like 3, 9 270 from a flip of coin. Do you think it will assume a binomial distribution?. What right codes do I know need
Yes, that is the definition of a binomial distribution. To simulate the coin flips, look at the SAS documentation for the RAND function and the "Bernoulli" distribution. A (more complicated) example is available in this blog post.
From a statistical physics point of view, wouldn't it be a better analogy to call the first sequence too cold and the second one too hot?
If you prefer. It depends whether you are talking about the length of the sequences of Heads and Tails or whether you are talking about the number of sequences. In the first example, the length of each sequence is too long. In the second example, each sequence is too short. However, it is also true that the first example has too few sequences and the second example has too many. No matter how you look at it, the third example is "just right," which is the point of the article.
What if Mama Bear, Papa Bear, and Baby Bear each had a their own peculiar habit of coin-tossing, such that Goldilocks might try to distinguish between Mama Sequences, Papa Sequences, and Baby Sequences. She will first attempt to categorize the sequences into three buckets, and then calculate a "best fit" sequence to each of the three buckets (i.e. minimum variance between each of her "best fit" sequences, and the bucketed data those "best fit" sequences are meant to describe). What type of analysis would she be doing here?
I guess I would call this a "model selection" analysis. If each sequence is data, she would fit three different models to each sequence. She would need some sort of "information criterion" that she can use to compare the fits and to assess which model is the best for each sequence.
Thanks! Yes, I suppose the information criterion would be that a) only three models can be used; b) each observed sequence will be compared to only one of the three models; and c) total variance of "system-to-model" must be minimized. The tricky thing is that the model sequences are not given, nor are the pairings of observed sequences with model sequences. Those things must be calculated. Since H/T is binary, I believe we should be able to calculate those things mathematically, just not sure how. Maybe a clustering algorithm?
Anyways, thanks for the quick response on a thread that is now...7 years old!
Consider computing the distance between the data sequence and the "target" models. Let N=6.
If the target sequences are
S1 = {0,0,0,1,1,1}
S2 = {0,1,0,1,0,1}
then for a random sequence like S={0,0,1,0,0,1} you can compute
d1 = dist(S, S1) = 1.732
d2 = dist(S, S2) = 2.236
and conclude that the closest target sequence to S is S1.
If you don't know the target sequences, but want to derive them from data, you can use clustering.