A while ago I saw a blog post on how to simulate Bernoulli outcomes when the probability of generating a 1 (success) varies from observation to observation. I've done this often in SAS, both in the DATA step and in the SAS/IML language. For example, when simulating data that satisfied a logistic regression model, the probability of success is a function of a linear combination of the explanatory variables. Accordingly, the probability of the binary response varies from observation to observation.
In vector languages such as SAS/IML, the key to efficient simulation is often avoiding writing a loop. In SAS/IML, you can use a clever trick to ensure that your simulation is efficient: call the Base SAS RAND function instead of the SAS/IML RANDGEN routine! This may seem strange to experienced SAS/IML programmers. Why would anyone call the RAND function from within SAS/IML? Isn't it the case that the RAND function returns a single scalar value, whereas a single call to the more efficient RANDGEN call fills an entire matrix with random values?
Well, yes, and no. If you call the RAND function from a SAS/IML program, the function returns a scalar value for each parameter that you specify as an argument. (This is generally true when calling Base SAS functions from SAS/IML software.) This means that the RAND function returns a vector of random values when you pass in a vector of parameters.
Let's see how this works. Suppose I want to sample observations from the Bernoulli distribution with probability of success p. For the first 10 observations I want to use p=0.05. For the next 10, I want to use p=0.5. For the last 10, p=0.95. The following SAS/IML statements create a 10 x 3 matrix whose columns contain the specified probabilities. The matrix is passed to the RAND function, which returns—tah-dah!—a 10 x 3 matrix of values where each column is a sample from a Bernoulli distribution with a different parameter.
proc iml;
prob = {0.05 0.5 0.95};
p = repeat(prob, 10);   /* repeat row 10 times */

call streaminit(321);   /* or call randseed(321); */
x = rand("Bernoulli", p);
print x; |

Notice that the first column of the resulting matrix is all zeros because the probability of getting a one is only 0.05. The middle column (p=0.5) is roughly half zeros and half ones, and the third column (p=0.95) is almost all ones. There are no loops required.
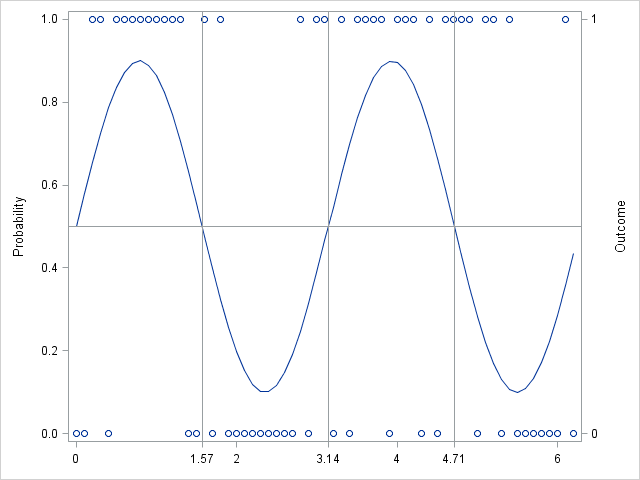
As a more contrived example, suppose that the probability of some event occurring has a cyclical nature. This might model, for example, the probability of buying a seasonal item such as a winter coat or a swimsuit. The following SAS/IML program create a vector of parameters that vary sinusoidally between ± 0.9. Binary outcomes are generated according to the parameter vector:
t = do(0, 2*constant("PI"), 0.1);
r = 0.5 + 0.4*sin(2*t);

/*  simulate each observation from a different distribution */
y = rand("Bernoulli", r); |
To visualize the probability and the outcomes, you can create a graph that shows the parameter values and overlays a scatter plot that shows whether each binary outcome was 0 or 1:
create Bern var {t r y}; append; close Bern;
quit;

proc sgplot data=Bern noautolegend;
series  x=t y=r;
scatter x=t y=y / Y2AXIS;
refline 0.5 / axis=y;
refline 1.57 3.14 4.71 / axis=x; /* pi/2, pi, 3pi/2, 2pi */
yaxis  label="Probability" min=0 max=1;
y2axis label="Outcome" values=(0 1);
xaxis display=(nolabel) valueshint values=(0 1.57 2 3.14 4 4.71 6);
run; |

In summary, you can call the RAND function from a SAS/IML program and pass in a vector of parameter values. The result is a vector of random values, where the ith value is drawn from a distribution with the ith parameter values.
Of course, you can also generate data like these by using the DATA step. Furthermore, in SAS/IML 12.1 and beyond, the RANDGEN function supports vectors of parameters.

6 Comments
Hi Rick. I'm doing some multivariate meta-analysis and I have, say, 10 studies where each study has 2 effect sizes (deltas), thus each study has a 2x2 variance-covariance matrix. How do you read the data in PROC IML? You're blog has been very helpful. Thanks!
If the covariances are in four separate variables "x1":"x4", read those variables and then use the SHAPE function to recast each 1x4 row as a 2x2 matrix before you use it. If the covariances are in two variables {x1 x2} and extends across two rows, use READ NEXT 2 VAR {x1 x2} INTO COV within a DO DATA loop, as demonstrated in this article on reading blocks of data.
If this doesn't answer your question, post your question and example data to the SAS/IML Support Community
Hello Rick. How I can simulate data that satisfied a logistic regression model with probability of success that is a function of a linear combination of the explanatory variables such that the probability of the binary response bernoulli distribution is p to get value "zero" and probability (1-p) to get the value "one"?
Thank you.
That sounds like a standard simulation of data that fits a logistic model.
Yes. How we can guarantee that the probability of the value zero to be "p" and the probability of the value one to be "1-p"?
Thank you.
If I understand your question, the link I provided contains SAS code that answers it. If you disagree or have other related questions, please post a detailed question to the SAS Statistical Procedures Community.