Some SAS products such as SAS/IML Studio (which is included FREE as part of SAS/IML software) have interactive graphics. This makes it easy to interrogate a graph to determine values of "hidden" variables that might not appear in the graph. For example, in a scatter plot in SAS/IML Studio, you can double click on a marker to see the values of all variables for that observation.
By contrast, the ODS statistical graphics in SAS are static. However, you can use various techniques (such as labeling or coloring observations) to add additional information to a graph. This article describes how to add a "tooltip" to a scatter plot that is produced by the SGPLOT procedure. In ODS graphics, the tooltip is known as a "data tip." It is also known as a "hover box" or an "infotip."
Enable tooltips with the IMAGEMAP option
A data tip is a little window that appears when a mouse pointer hovers over an observation. In SAS 9.3, data tips are available only for the HTML destination. (Recall that HTML is now the default output destination when you run the SAS 9.3 windowing environment.) By default, a data tip gives the values of the X and Y variables in a scatter plot. You can turn on data tips in ODS graphics by using the IMAGEMAP option on the ODS GRAPHICS statement.
For example, the following statements enable data tips and create a scatter plot of two variables in the Sashelp.Cars data:ods html; /* use HTML destination */ ods graphics on / imagemap; /* enable data tips */ proc sgplot data=Sashelp.Cars; scatter x=Weight y=MPG_City; run; |

Notice the data tip displays the values of the X and Y variables when the mouse cursor hovers over an observation marker.
Data tips for hidden variables: Let PROC SGPLOT do the work!
A data tip can also display the values of additional variables. Suppose that you want to enhance the data tip for the previous scatter plot to show the "make" of a car (for example, BMW, Ford, or Toyota). In SAS 9.3, PROC SGPLOT does not support syntax to add the value of the MAKE variable onto the data tip. However, the Graphics Template Language (GTL) has this functionality, and you can get PROC SGPLOT to write the GTL for you!
This is great news, because some people find the GTL intimidating. However, if you can create a plot in PROC SGPLOT, you can also generate the GTL that creates the same plot. (The template is not particularly useful for plots that contain "summarized data," such as a bar chart.) To generate the GTL, add the TMPLOUT= option on the PROC SGPLOT statement. For example, the following statement writes the GTL for the scatter plot to the file C:\MyTemplate.txt.
proc sgplot data=Sashelp.Cars tmplout="C:\MyTemplate.txt"; scatter x=Weight y=MPG_City; run; |
You can open that file in an editor and paste it into SAS. The code for this example looks like this:
proc template; define statgraph sgplot; begingraph /; layout overlay; ScatterPlot X=Weight Y=MPG_City / primary=true LegendLabel="MPG (City)" NAME="SCATTER"; endlayout; endgraph; end; run; |
I emphasize that you do not have to write this GTL code; PROC SGPLOT generates it for you!
You can edit this code to add a tool tip that includes the value of the MAKE variable in the data set. On the SCATTERPLOT statement, delete the semicolon and add the ROLENAME= and TIP= options:
ScatterPlot X=Weight Y=MPG_City / primary=true LegendLabel="MPG (City)" NAME="SCATTER" rolename=(Label=Make) tip=(X Y Label); /* add new options */ |
The ROLENAME= option associates a name (Label) with a variable (MAKE). The TIP= option specifies the information to display in the tooltip. You can display the new graph by calling the SGRENDER procedure:
proc sgrender data=Sashelp.Cars template=sgplot; /* use GTL template */ run; |
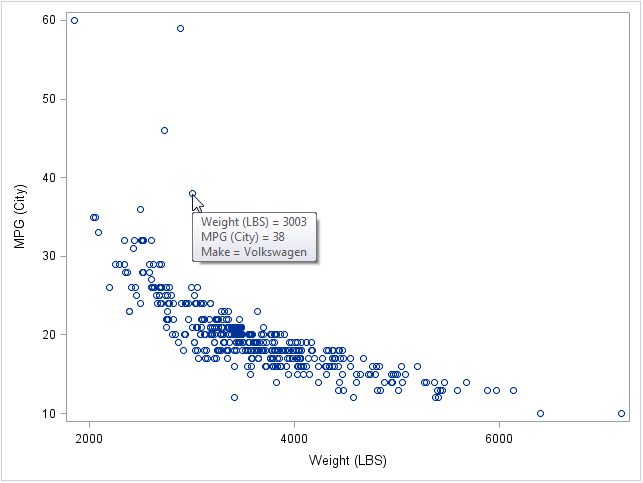
As shown in the image, a tooltip shows the make of the vehicle when the mouse pointer hovers over an observation marker.

11 Comments
in SAS 9.3, tmplout= option in sgpanel was not supported any more. That sounds very strange. any specific reason?
Jingju
The SGPANEL procedure can create a number of computed panel displays that currently cannot be generated directly through GTL. The template that is generated in those cases cannot be executed by PROC SGRENDER. Because this situation can happen frequently, we removed the TMPLOUT option from that procedure in 9.3 to help prevent any confusion.
Pingback: Women and jobs: Redesigning a New York Times graphic - The DO Loop
Pingback: Scatter plots with logarithmic axes…and how to handle zeros in the data - The DO Loop
I want to add custom tootips (and drill-down), not just the values of the graph variables; Any way to do this like we do so easily with option HTML= in SAS/GRAPH? Thanks.
You can ask question like this at the SAS Support Community. For graph-related questions, use the SAS/GRAPH and ODS Graphics Community.
Pingback: Label markers in graphs by using the values of several variables - The DO Loop
Pingback: Create spaghetti plots in SAS - The DO Loop
I need to help me calibrate the model of fuittes depending on the age and number of repairs
Q = (q0x (n / (n + X0))) + (Q1x ((nx X0) / ((n + X0) * (n + X1)))) * exp (n * t) - (q1 * R )
X0 = (n * (q0-q 0 * (n / (n + X0))) + (q1 * ((n * X0) / ((n + X0) * (n + X1)))) - (q1 * (X0 * X1 / ((n + X0) * (n + X1))))) / ((q0x (n / (n + X0))) + (q1 * ((n * X0) / ((n + X0) * (n + X1)))) - + q1 (q1 * (X0 X1 / (* (n + X0) * (n + X1)))))
X1 = n * (X0 * X1 / ((n + X0) * (n + X1))) * ((q1-q0) / (q0 * (n / (n + X0))) + (q1 * (( No. X0) / ((n + X0) * (n + X1)))) - q0 + (q1 * (X0 X1 / (* (n + X0) * (n + X1)))))
or R number of repair
They can be set q 0 and n in an interval
-T Given time
It remains to be q1, X0 and X1
You can ask questions like this at the SAS Support Communities.
Pingback: Influential observations in a linear regression model: The DFBETAS statistics - The DO Loop