The log transformation is one of the most useful transformations in data analysis. It is used as a transformation to normality and as a variance stabilizing transformation. A log transformation is often used as part of exploratory data analysis in order to visualize (and later model) data that ranges over several orders of magnitude. Common examples include data on income, revenue, populations of cities, sizes of things, weights of things, and so forth. (Remember, however, that you do not have to transform variables! Some people mistakenly believe that linear regression requires normally distributed variables. It does not!)
In many cases, the variable of interest is positive and the log transformation is immediately applicable. However, some quantities (for example, profit) might contain a few negative values. How do you handle negative values if you want to log-transform the data?
Solution 1: Translate, then Transform
A common technique for handling negative values is to add a constant value to the data prior to applying the log transform. The transformation is therefore log(Y+a) where a is the constant. Some people like to choose a so that min(Y+a) is a very small positive number (like 0.001). Others choose a so that min(Y+a) = 1. For the latter choice, you can show that a = b – min(Y), where b is either a small number or is 1.In the SAS/IML language, this transformation is easily programmed in a single statement. The following example uses b=1 and calls the LOG10 function, but you can call LOG, the natural logarithm function, if you prefer.
proc iml;
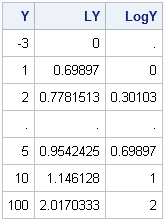
Y = {-3,1,2,.,5,10,100}; /* negative datum */
LY = log10(Y + 1 - min(Y)); /* translate, then transform */ |
Solution 2: Use Missing Values
A criticism of the previous method is that some practicing statisticians don't like to add an arbitrary constant to the data. They argue that a better way to handle negative values is to use missing values for the logarithm of a nonpositive number.
This is the point at which some programmers decide to resort to loops and IF statements. For example, some programmers write the following inefficient SAS/IML code:
n = nrow(Y); LogY = j(n,1); /* allocate result vector */ do i = 1 to n; /* loop is inefficient */ if Y > 0 then LogY[i] = log(Y); else LogY[i] = .; end; |
The preceding approach is fine for the DATA step, but the DO loop is completely unnecessary in PROC IML. It is more efficient to use the LOC function to assign LogY, as shown in the following statements.
/* more efficient statements */ LogY = j(nrow(Y),1,.); /* allocate missing */ idx = loc(Y > 0); /* find indices where Y > 0 */ if ncol(idx) > 0 then LogY[idx] = log10(Y[idx]); print Y LY LogY; |
The preceding statements initially define LogY to be a vector of missing values. The LOC function finds the indices of Y for which Y is positive. If at least one such index is found, those positive values are transformed and overwrite the missing values. A missing value remains in LogY for any element for which Y is negative.
You can see why some practitioners prefer the second method over the first: the logarithms of the data are unchanged by the second method, which makes it easy to mentally convert the transformed data back to the original scale (see the transformed values for 1, 10, and 100). The translation method makes the mental conversion harder.
You can use the previous technique for other functions that have restricted domains. For example, the same technique applies to the SQRT function and to inverse trigonometric functions such as ARSIN and ARCOS.
WANT MORE GREAT INSIGHTS MONTHLY? | SUBSCRIBE TO THE SAS TECH REPORT

197 Comments
Did you know that SAS now has a LOG1PX function that "returns the log of 1 plus the argument"? It's true!
http://support.sas.com/documentation/cdl/en/lrdict/64316/HTML/default/viewer.htm#a003121132.htm
Dear Rick, I have a panel data of firms,years, industries, and profits.Would you please tell me how to write sas commands to calculate the median profits of all firms (excluding each focal firm) for each year in every industry?
Many thanks in advance, James
Yes, you can get all of your SAS questions answered by posting to the SAS Support Communities. Provide sample data and desired output whenever possible.
Hey Rick! If i am doing a regression using the fixed effect model and I have the total Fdi as my dependent variable, and I want to regress it against economic freedom and real GDP. It is ok to use the log of total Fdi even though, it has a negative values.
Pingback: Complex assignment statements: CHOOSE wisely - The DO Loop
Dear Rick
My data set includes stock return of around 1000 companies. In most cases sometimes the return data shows a -34.5 to -108 figures. How to make log transformation in this case. How much should be the constant value in this kind of data. Please help.
It depends somewhat on what you're trying to do, but you might want to express the returns as a percentage, measured from the start of the time period (1 yr, 5 yrs, or whatever). Then the Negative returns are bounded by -100 percent, and you can safely compute log(101 + return).
Dear Rick,
My instructor is very reluctant to model on percentages. He said averaging on percentage did not make sense since we had different denominator. Do you normally modeling on percentages? Thanks.
I do not. However, I don't think there is an inherent reason to avoid proportions and percentages. It is true that proportions are different from continuous unbounded data. However, power transformations are still useful and the analogue of the log transformation for proportions is the logit transformation: logit(y) = log(y/(1-y)). Atkinson's (1985) book on "Plots, Transformations, and Regression" has a whole chapter devoted to transformations for percentages and proportions.
Thanks Rick,
when the negative values are bounded by -100 percent,can you explain why using log(101 + x) and not log(100+x)?
Because log(0) is undefined.
Thank Rick,
Can you please tell me if that will change the interpretation of the model?
lets say Y(level)=a+bln_x
and we add 1 to x. will that change the interpretation?
Arshad
If you let z=1 + x, then the model Y = a + b*ln(z) has the usual interpretation.
Pingback: The Poissonness plot: A goodness-of-fit diagnostic - The DO Loop
Pingback: Extending SAS: How to define new functions in PROC FCMP and SAS/IML software - The DO Loop
Dear Rick
I have a data set for which the dependent variable is both positive and negative. Would you say an alternative is to take absolute values, then take logs, before multiplying the original values with -1. For me this seems reasonable, but I am not sure if I can interpret my coefficients in terms of percentage changes any more?
All best
Gjermund
Well, I don't know your application, but I don't think I would recommend that approach because the LOG function has a singularity at zero. The LOG transformation is best for mapping changes that are between 0 and infinity. For example, if you buy a stock at a certain price, the quantity Price/Purchace_Price is always positive. It can be log-transformed. It sounds like your variable might be "relative change" such as (Price-Purchase_Price)/Purchase_Price, which can be positive or negative. I wouldn't use a log transform for the second quantity.
Good Day,
I am commenting on this particular reply because you told someone face a problem similar to mine to refer to the solution you provided to this problem. Well I am using Eviews 6,in my study I have encountered negative GDP and FDI growth rates. Please advise on how I could apply your transformations to my data. Thank you
Read the article and do what it says. You will need to learn how to transform data in EViews.
Thank you for the prompt response. I did exactly what as you instructed in solution one of the article, the software is now asking me to define"min". How do I do that?
"Min" will be the smallest value for the variable that you are transforming. So if the smallest (=most negative) GDP growth is -1.2, you would use -1.2 as "Min" for GDP.
Upon rereading your comment, perhaps you were attempting to form a transformation like this: y --> sign(y)*log(|y| + 1)
Dear Rick
I have data set of both positive and negative value. I have changed the large number with minus sign among the treatments to zero by adding equal positive number and also to all treatments, then I have analyzed by SAS. But I am not sure, please would you help me?
All best
Abera
To everyone who has questions about applying these ideas to specific data:
1. If you have a question about HOW (or why) to best transform specific data, post your question to the SAS Statistical support group at https://communities.sas.com/community/support-communities/sas_statistical_procedures
2. If you have a question about SAS/IML SYNTAX or are getting a programming error, post your question to the SAS/IML support group at https://communities.sas.com/community/support-communities/sas_iml_and_sas_iml_studio
In both cases,
1. supply sample data,
2. state what you've tried, and
3. link to this post so that the people who read your question know the context of your question
Dear Rick
I have to apply regression to Return on equity ratios, return on asset ratios, GDP growth, Inflation % and Real interest rate.
Problem lies where I want to take natural log of data of all variables. All data is in % form but have positive or negative values. e.g. ROA =0.328% and ROE = -7.92%. I can easily apply natural log to 0.328% value and get -1.11474 but how can I apply natural log to the negative value? if you could please shoe me how and give me a figure to see.
is there any way if I just write 0 for this entry and perform my regression? It may give wrong results.
Use the proportion y = Price / Purchase_price.
This is always in the interval (0, infinity) for non-bankrupt stocks, and y=1 means that the price has not changed since it was purchased. If this quantity spans several orders of magnitude, you can apply the log(y) transform.
Sir, I am using Eviews 7 and I have values in my data set for presidential approval ratings which are negative. I need to use log of the ratings but Eviews cannot compute it. How do I get rid of the negative values? Thank you!
You don't need to use the log of the rating, just use the ratings as given. Logarithms are used when data many orders of magnitudes, which doesn't apply for approval ratings. If you insist on transforming the data, use y = (r+100)/200, which maps the rating (r) from [-100,100] to [0,1].
Hello Rick!
I have a question regarding the interpretation of log transformed data where the constant was added to avoid some negative values. Should we still interpret the results in the way that 1% change in independent value leads to ß % (which is a coefficient found after regression) change in the dependent one? (both dependent and independent variables were log transformed)
Thanks!
No, the interpretation is that a unit change in the LOG of the indep var leads to change of beta in the LOG of the dependent variable. This is a much more difficult interpretation because the "unit change in log(x)" now depends on x. At small values of x, log(x) changes quickly; for large values of x, log(x) changes slowly.
Hello Rick,
My questions relates to this post. I have some data that ranges from 0.0 to 1,960. I added 1.0 to all values and then ran a natural log transformation to make all transformed values >=0. Next, I computed the arithmetic mean (and 95% CIs) of the logged transformed values (for several levels of categorical variables). I exponentiated these arithmetic means and CIs to get the geometric mean and its CIs. My question is: do I need to subtract 1.0 from the geometric mean and each CI to properly put it back in the original scale? Or is some other adjustment necessary? I became concerned that this approach was not adequate when I added other arbitrary values (0.001, 2, etc) prior to log transformation and (after exponentiation) was not able to adjust the numbers to the same values by subtracting out the constant added during the linear transformation.
Excellent blog. Thanks for your time.
Tom
Yes, you would need to invert the transformation, which would include adding the constant.
When you say "compute mean and CIs," I assume that you are using the standard formula xbar +/- t*s/sqrt(n), where t is a quantile for the t distribution. This formula assumes normality, so whether the CIs are good depends on whether the transformed data is approximately normally distributed for each level of the categorical variables.
Thanks for the prompt reply. I am not sure I follow. Could you clarify using my code (pasted below)? I am using SAS to output means of the logged values (here's my macro code):
&varname = categorical variable
log_adj_wipval_b = logged dependent variable
title "&Varname: Logged Value Mean";
proc means data = master;
class &varname;
var log_adj_wipval_b ;
output out=&varname._m mean=m_&varname lclm=lcl_&varname uclm=ucl_&varname;
run;
In the next step I exponentiate and print the values. Can you advise me on how to adjust this step?
data &varname._m2;
set &varname._m;
*Subtract 1.0 from each;
C_geo_&varname = exp(m_&varname) - 1.0;
C_geo_lcl_&varname = exp(lcl_&varname) - 1.0;
C_geo_ucl_&varname = exp(ucl_&varname) - 1.0;
The code is correctly computing the pre-image of the normal CIs of the transformed data.
Hello Rick,
I am working on human capital investment and economic growth, and my dependent variable is Real GDP, while my independent variables are labor, capital, government expenditure on health and education. my proxies are labor force population, gross fixed capital formation, government expenditure on health and education, life expectancy rate and adult literacy rate. However, I need to know which ones to log and whether to use natural or common base 10 logarithm, and why I should use one instead of the other. Thank you very much.
A simple rule of thumb is to log-transform variables that range over several orders of magnitude. For example, if one country has a population of one million and another has a population of a billion, that is three orders of magnitude, so a regression model that includes the log(population) is worth considering. For your variables, I would choose base 10 because the results will be more interpretable. If you see that log10(X) is close to 3, you can use mental arithmetic to figure out that X is close to 1,000.
Hi, Rick. Using log(Y+k) to deal with zero and negative values of the outcome variable seems to be problematic, if I care about the interpretation of beta_1 in E[log(Y+k)] = beta_0 + beta_1 X. I've seen some data analysts exponentiate the right side of the equation and then they subtract k to complete the backtransformation. But this isn't right, as E[log(Y+a)] = log GM(Y+a), where GM is the geometric mean. So my question is: for E[log(Y+k)] = beta_0 + beta_1 X, what is the interpretation of beta_1? If k=0, then [exp(beta)-1] has the neat interpretation of percentage change in GM(Y) for a unit increase in X. But if k is not 0, do we have a similar interpretation?
- Jacob
You've hit on a key issue: how do you interpret statistics that result from (any) transformation of a variable? As you point out, some transformations have simpler interpretations than others. There have been many books and papers written on this topic, and I recommend the ones by AC Atkinson. His book _Plots, Transformations, and Regression_ describes transformations for a wide variety of situations.
Sir,
I have a data set of food expenditures with the consumed quantities. Since there is no data about per unit prices, I got it as expenditure/quantity. Then I got the natural logarithm of prices using stata. But most of the values came as negative. I'm afraid of my results & I want to know can natural log values of prices be negative. What does it mean by the negative sign? Please help. Thanks in advance.
Yes. The log can be negative. In your case it means that the ratio is less than 1.
Hello Rick, thanks for the useful blog.
My model (OLS regression) consists of depend. variable being the industry return and then the 3 indep. var. are total market return/oil price return/natural gas return. Each of these returns I want to log
I need to transform the negative numbers to use the log and do it the firs way suggested..
I apply =log(1+*value of return*) My question is, Should I apply the +1 for all 2608 observations I have?? Or only for the negative ones.
I am very grateful for an answer here.
Regards, Moni
The transformation is applied to the entire variable, so you should apply it to all 2608 observations.
Hi Rick
I have savings data set with both negatives and positives. How do I log transform it in eviews especially the negatives?
See my previous responses, especially to "Gjermund Grimsby."
hello rick,
i have few independent variables, which are earnings per share, book value and fair value. The problem is, i got negative data for earnings per share(EPS). So, should i just transform the EPS to log (1+ EPS) or i need to do the same to book value and fair value?
Tq
You do not need to transform each variable in the same way. It seems to me that EPS can be less than 1, so that 1+EPS can still be negative, so be sure to look at the most negative value of EPS before you decide on a transformation.
Hi Rick,
Is that necessary for all variables to be normal distribution if we want to run multiple regression? I did transform some of my variables but the result is still not normal. So, what should I do then? Your suggestion is really appreciated.
No, regression does not require that the explanatory variables be normally distributed. If you do an internet search for "assumptions of linear regression" you will find many articles, including a blog post I wrote about the normality assumption. If you want to do inference on the least square estimates (the regression coefficients), you assume normally distributed ERRORS (residuals). That is, the Y variable is linearly related to the X variables plus some unknown error term that is normally distributed.
Rick, just to go one further, I would assume that if we relax the expectation of normality on the response variable, you would merely look for independence among the residuals? The MLE wouldn't be applicable, thus losing normality-based confidence intervals on the parameter estimates, but the OLS theory still holds and thus the point estimates themselves are BLUE / unbiased?
On a more practical note, if you have a variable that appears to have exponentially greater gaps on both positive and negative ends, can you suggest a good transformation to use? I've been eying up arctan(), but would piecewise log transformation of the positive and negative sides (flipping the negative to positive and sending the log back to negative) be a better option? Many thanks.
As you say, OLS predictions are often valid even if all of the assumptions of linear regression are not satisfied. Several of the assumptions affect inference (standard errors and confidence intervals) but do not invalidate the point estimate (prediction).
Regarding transformations, the inverse hyperbolic sine (arsinh) is one function that comes to mind. The other is the log-modulus transform. The shape of these two functions are very similar.
hi Rick,
I have a problem with normality test again. In order to make sure that I can use parametric test, I need to make sure that my residual distribution is normal. However, when I refer to the value of skewness and kurtosis of the residual, it is -0.017 and -0.438 respectively, where i think this is considered as normal. Unfortunately, when i do kolmogorov-smirnov, the significant value is 0.021, which indicates the residual is not normal. The sample of my study is 290. Could i just ignore the kolmogorov-smirnov test and assume the residual is normal as the data is large?
In practice, many people just "eyeball" the residuals to check that they are approximately normal. If the residuals are approximately normal, the inference on the regression coefficient will still be good. The quantile-quantile plot in PROC UNIVARIATE is probably more valuable than the K-S test for assessing (approximate) normality.
Hello rick. i'm trying to log the size of firm before i run a GMM regression. Size of firm is defined as:
size = (common stock/book value) x stock market price
But the problem is, there are many negative value there. How do i log the data. should i just treat the negative value = 0? When i log the whole data using microsoft excel, the negative values are treated as 'missing'. So can i just run the GMM regression though there are missing values? is there any best alternative to handle the situation. Thanks.
First, if you run the regression with missing values, you are excluding all of that data when you construct the regression model. I wouldn't do that.
It seems like the problem is the definition of "size". I think most people expect "size" to be a positive quantity, such as "market capitalization" or something similar. If you can, change the way that you measure size.
Hi I am working on GDP forecasting.The amount is very high .So to make it stationary,I transform data into log difference .I am using eviews 7.After forecating data I dont know how to convert these values into origional values.These values have become very small.Could you help me please in this regard thanks
If you are predicting log(GDP), then exponentiate the predicted values to get back to the original scale.
Sir I am predicting d(log(gdp))
i using ARIMA MODELING.So i transform the data by using first difference logrithm.Now i got the forecasting results.But after transformation data is changed So i want to bring the data back to its origional form.I used follow transformation
d(log(gdp))=log(gdp)-log(gdp)(-1)
only exponentiate does it work?
I suggest you ask your question at https://communities.sas.com/community/support-communities/sas_forecasting
if you log transform Y to do a time series analysis, the way you go back to simple Y is:
Predicted(Y) = EXP ( Predicted(LogY)+0.5*STD*STD );
where STD is the standard deviation predicted for LogY.
dear sir, I am doing inward FDI as a dependent variable, it has positive numbers and negative numbers, the data start from 75,and the number become larger as a time series, and the lowest number is -15348, if I plus 15348 to make all the number positive, then the first data will become very large, as GDP is a explanatory variable, if plus such a big number will the regression affected?I use eviews 7. how can I do?
lnFDI is measuring the % change of FDI in the regression, so can I just use FDI minus last period FDI, and calculate the change rate, use the growth rate of FDI instead, but without log?
Adding a constant to the response only changes the regression by changing the intercept. If you then apply a log transformation, it becomes harder to interpret the regression coefficients in terms of intuitive quantities such as %change. I think in your case you should plot the data. Is inFDI linearly related to GDP? If so, don't apply the transform. If not, tapply the log(Y+c) transform. Is the transformed response linearly related to the explanatory variables? SAS and other statistical software provide graphical diagnostic plots that you can use to assess the fit of the model.
Hi Rick,
I have monthly growth data, which is sometimes negative. There is a desire for the growth to be measured on a per day basis (so, growth per day). I had been using the method you described Y*=ln(y+a). But, several on the team are not comfortable with that. An alternative suggested was taking the log of the values prior to differencing them. If this is the dependent variable of a log-log model, would the coefficients with this transformation be interpreted the same way as the Y*=ln(y+a) would be interpreted? What can I do with the per day aspect of this?
I really appreciate this thread, and all the useful feedback you are personally supplying.
In general, I think it is wise for analysts to be skeptical of advice found on the internet! To answer your question, if you take logs first and then difference them, you are forming the log of a ratio, since log(y_{i+1}) - log(y_i) = log(y_{i+1} /y_i). This would mean that you would be examining the "proportion of change" from one year to the next. Assuming that none of your data are zero, this is a reasonable thing to do. It centers the "no change" situation at 1 instead of 0, and it also eliminates negative numbers (assuming your data are positive).
Try graphing the proportion of change without the log: z_i = y_{i+1} /y_i. Perhaps you can do your regression on that proportion. If so, that's what I'd try.
Thanks for your feedback! I really like the log-log because the coefficients are easy to interpret. How would you interpret coefficients in this proportion change model?
Same as usual: the change in the proportion when an explanatory variable changes by one unit. But you're right that this model is not used as often as the log-log model.
I have a large absolute value as a dependent variable and some equally large independent variables.The other remaining independent variables are in rates.i want to do a regression and wants to introduce logs,how do i go on it?
Let's say that your independent variables are X1, X2,..., Xp and your dependent variable is Y. To use logs, define LX1=log(X1),..., LXp=log(Xp), and LY=log(Y). Then use regression to model LY as a function of LX1, LX2,..., LXp.
Hi Rick, this blog is really great! I don't have negative numbers, but I do have values below one, which when transformed, turn into negative values. I understand why this happens but I am not sure if this affects my analysis of the data and in which way.
In general the answer is that it is okay to get negative values. For example, if you are analyzing the GNP of nations in units of Trillions of dollars, small and third-world nations will have a negative log(GNP), whereas major industrial nations will not.
Hi, I am working with measurements of the conductivity of water and discharge of water. I want to produce a non linear regression to demonstrate the relationship between to two. When I did the log transformation of both these variables the discharge has all come back negative. How do I fix this? Do I add a constant when I am working out both logarthims ?
A value that is between 0 and 1 will be transformed to a log-value that is negative. There is nothing to "fix."
Pingback: Square root transformations: How to handle negative data values? - The DO Loop
Dear Rick,
Thank you for your effort on this page, it is very helpful. I am forecasting inflation in Eviews 7, and some of my relative variables are negative and not normally distributed. The smallest negative number is -1,5%. From what I understood of the above comments is that I should take log(x+1,5) of this series to convert the negative numbers into positive? (and thus to check for normality again)
Is that correct?
Thank you!
Yes, that sounds right. Two comments:
1) log(0) is not defined, so add a number GREATER than 1.5 to make sure that when x=-1.5, you don't get log(0). The actual number doesn't matter much: 1.6 would work, as would 1.51 or even 2.
2) I assume from your note that x is measured in terms of percent, so that min(x)=-1.5. If min(x)=-1.5%= -0.015, then you can divide my numbers by 100.
Hi,Sir...
I am doing my research proposal. I use interest rate, inflation, deflator for my independent variables..The data got negative value -X>0 and -X<0. I use this technique (lx1=@recode(x1>0,log(1+x1),-log(1-x1)) for log the data (http://forums.eviews.com/viewtopic.php?f=3&t=1212)
But at the end year, the data for value is NA...Is it any wrong ?? Sir, could you suggest the better technique for me to log the data??
I appreciate it. Thank you!
The only way that I can see that you would get NA is if the original data had an NA. Your transformation (which I like, and which can be simply written as sgn(x)*log(1+abs(x))) is defined for all real numbers, so the NA are coming from the data, not from the transformation.
It sounds like you are doing this transformation on the explanatory variables. For regressions and other analyses, there is nothing wrong with having negative values in explanatory variables. Furthermore, log-transformations are most useful for variables that stretch over many orders of magnitudes (such as population of cities), and none of the variables that you mention have large ranges. If it were me, I'd try using the original variables instead of transforming them.
Hi - I'm curious on your thoughts about choice of "a" for log(Y+a). The two minimum values in my data (negative, of course) don't appear to be outliers when viewed on the original scale. Depending on the choice of "a", they can be made to look like severe outliers (if Y+a is very near zero or one) or not to appear like outliers at all (as Y+a increases). This has obvious implications when analyzing via regression. I know you mention 0.001 or 1 as minimums above, but are there any good resources for determining a proper "a"?
Thanks for your time and effort.
You ask an interesting question. When applying a nonlinear transformation, you are going to change the distribution of the response. Usually you are starting with a response distribution that is skewed and you are trying to transform it into a distribution that is closer to normal. That is why the log transformation is one of the so-called "transformations to normality" or "normalizing transformation." As you point out, the choice of 'a' affects the distribution of the transformed variables. So which value of 'a' to choose?
I'm guessing that you should strive to choose a value that makes your transformed response most nearly normal. If a = min(y) + 0.0001, then the response will be strongly negatively skewed relative to its original skewness. If a = min(y) + 1, then the response will be moderately negatively skewed relative to its original skewness. If a = min(y) + 1000, then the skewness hardly changes at all (assuming the range of Y is small). Unfortunately I do not have a reference for this idea, but it reminds me of the "Box-Cox transformation," which optimizes a parameter in a family of power transformations.
I have data in the form of area in cm square..so what kind of transformation values I used to minimize or stabilize varibilty n data.
I'd try a square root transformation.
Hi Rick,
I am constructing an Error Correction Model using Panel Data in STATA. I was trying to obtain the natural logs of my dependent variable (ratio of Capital flight/Real GDP) and independent variables (Interest rate differential, Financial Openness- [Chin-ito index], real exchange rate) for 4 countries. I am however, constrained since all my variables contain negative numbers. I was keen on transforming since they all have different magnitudes. How would you advice I proceed in such an instance?
If "4 countries" means "4 observations," then your regression isn't going to be very good. But to answer your question, if your goal is to reduce the order of magnitudes in a variable, you can use the log-modulus transformation: y --> sign(y)*log(|y| + 1), which is a continuous transformation that preserves signs.
Pingback: Scatter plots with logarithmic axes…and how to handle zeros in the data - The DO Loop
Pingback: A log transformation of positive and negative values - The DO Loop
Hi Rick,
I have absolutely no question at all, just wanted to say that I'm absolutely amazed by your responses here to a bunch of very badly phrased questions (even from people who aren't using SAS at all!). You're doing the work of dozens of undergrad thesis advisors - amazing!
Thanks, you made my day. Yes, some of the questions contain fewer details than I would prefer, and some of my responses are no more than educated guesses. I readily admit that I am not The World's Foremost Expert on Transformations, so I hope none of these folks are relying exclusively on my judgement. Remember, never trust advice found on the Internet! :-)
Pingback: Beware the naked LOC - The DO Loop
dear Rick.
Am using eviews to test for normality of inflation values but even when I log or add a constant it does not become normally distributed. The values of inflation that am using are quarterly changes in inflation so some of the values are negative. Please help advise me on how to make the variable normally distributed. thanks
Not all data are normally distributed. Not all data can be made normal by taking a logarithm. But that is okay because normality is not a requirement to run a linear regression. After you run a linear regression you should check the RESIDUALS of the regression. If these RESIDUALS are normally distributed, then that is evidence that your regression model captured the relationship between your response and your explanatory variables.
Hi Rick,
I have marginal cost variables (obtained from panel data analysis) that should be taken their log transformation in order to put it in the equation. But some of the data are negative. As I take the log transformations, the negative one's solution is undefined. How can I overcome this? Could you please help? Thank you.
Sure. Read the article on this page and do what it says.
Hello Rick,
I run a fixed effects model where the dependent variable is Gini index measuring income inequality and the independent variables are: FDI stock (% of GDP), inflation rate (% change of consumer price index), secondary school enrollment ratio, government expenditure (% of GDP), services value added (% of GDP), GDP per capita in PPP (constant 2011 international $). Except for GDP per capita and inflation rate which range up to 30 000 and 1000 respectively, all the other variables range up to 100. Do you think it is appropriate to take the natural log only of GDP per capita as is the practice in similar studies and work with the original values of all the other variables? Or is it better to take natural logs of all the variables in the model? Some studies do it the first way, some – the second and I cannot understand the logic behind this choice. (Moreover, in my case taking logs of all variables doesn’t help making them normally distributed).
Your help is highly appreciated!
It is fine to take the log of a subset of the variables.
Hi Rick
I have a sample of 30 FTSE100 companies' share prices and salaries for the respective CEOs, I have calculated averages for the share prices and the salaries so that I can run a regression, how do I transform these averages into logs in Eviews8
Sorry, but I do not use Eviews. I use SAS software.
what is the best method of transformation if the all Box-Cox transformation not satisfy for continuous response model and other alternatives to use?
Sir do you think it is actually appropriate to take the natural logs of rates like lending interest rates and ratios such as net domestic investment as a proportion of GDP
Dera sir
I want to do multiple regression on financial data. My dependent variable is market capitalisation I.e. Ts. In corers, where as independent variables are EPs, per, GPM, roe, ronw etc which are in percentage. Some of the data are having positive values whereas some have zero and negative values. What should I do? PLz suggest me.
how much should be the highest constant no.to be added if i have a negative data
Hi Rick
This blog is amazing...got to know so many things...ur suggestions are really helpful..I have a query..I am dealing with the time series of output, cost and cost of capital where all the values are positive but the series are not stationary..and the difference stationary series contains negative values and zero..now in my multiple regression model i am using logQ, logC, logK.. but log of negative values are undefined..how should i proceed now???...should i use signQ*log(IQI+a)??...if so, will it have any impact on co-efficient??How should i explain the result of regression??? Pls reply..i am stuck and need ur help.
Hey. My data has the variable "income" divided in percentage, like; how would a 15% income increase affect your consumption of beans, so the answers are:no change, less than the change in income, etc. the income change percentage options are 5%,10%,20%,25%. how can I regress this against quantity consumed?
Dear Rick, I am running a regression analysis on some macroeconomic variables. The variables are quarterly data, with some negative values. For example, quarterly GDP values have 234566.56, 345456.23, 678994.67, -345674.21, 879076.00, -12345.00. I would like to use logarithm transformation on them. But how can I deal with the negative values when in fact the negative values are not in single digit? Please advice.
Mahmud
The "Solution 1" section applies regardless of the magnitude of the negative values. For your data, the transformation begomes log(X + 1 - 345674.21).
Hi Rick,
I am working in determining the climatic variables that may affect the productivity and survival of birds. The thing is that all climatic variables have got different numeric scales (mean temperature, snowdays, frost days, rain days, precipitation, NAO index, etc). And maybe that could be a problem in analysis (we are trying a PLSR, and we got No Significance. Accoring to the KSmirnov test, the data is normal distributed). Most of the variables have got negative values.How can I transform them using the log transformation?
I will appreciate your help. Thanks alot :)
I forgot to mention, I am working with statistica 7.0 program.
I have used to transform positives values the log10(v1+1) (for example). Where v1 (variable1), etc.
thanks
I don't see anything in your data description that makes me think that your significance problem will be fixed by applying a log transformation. (Remember: In linear regression, the explanatory variables do NOT need to be normally distributed.) If the birds are affected in the way that the model specifies, and the effects in the model arelarge enough, you will get significant results. If you do not get significance then either (1) you model is wrong or incomplete or (2) you need more data to detect the small effects of your variables. In your case, it might be that local factors (abundance of food, nesting sites, predators,....) are so much more important to the birds than the global factors that you are unable to detect the small effects.
Sir Rick,
I am using stock prices index as dependent variable while Exports in value, Money Supply in value, Oil prices in value, Interest rate and Inflation rate in percentage, Industrial production as index. Which of these variables I need to log transform before applying other tests? As some of the variables values are large and others are small.
There is no statistical requirement to transform any variable. However, explanatory variables whose range is large can sometimes lead to
heteroscedastic residuals. After you fit the model for the original variables, look at the graphs of residuals vs explanatory variables. If any look "fan shaped," consider using the log transformation on those variables.
Hello Sir
what if a variable has negative values and positive both and log is taken considering absolute values? what would be the result.
This is called the log-modulus transformation. I have written a blog post about the log-modulus transformation that has an explanation and example.
thanks alot Sir.
Good day Rick.
Your answers have really helped me. Thank you.
I have a question regarding the interpretation of log transformed data where the constant was added to avoid some negative values or less than one both dependent and independent variables. Then i have got results of my regression. For example, I have 1 dependent and 2 Independent variables. The regression results showed that one of independent variables hava positive beta and the other have negative beta. The interpretation of positive beta variable is "Doubling the independent variable from the mean of e.g., 8.1% to 16.2% of companies yields a 7.5% increase in the dependent variable. the calculations might be (For example, average mean of dependent variable is 0.081 (8.1%), which means the value for the mean observation is ln(1.081). Doubling dependent variable to 0.162, means a 7.5% increase in the value 1.081 (0.075=0.081/1.081). To get the impact on the independent variable, multiply 7.5% times the coefficient if coefficient is 0.909, to get a 6.8% increase in the dependent variable. If the other variable have negative beta, then the interpenetration might be "A decrease of independent variable by half from the mean of e.g., from 6% to 3%". How we can further explain if beta is -2.48.... Please help me
As you've noticed, if you take laogarithms of Y and X, then the interpretation of coefficients becomes harder. In a simple model like log(Y) = b0 + b1*log(X), the original variables are related by Y = exp(b0)*X^b1. Let Y1 be the predicted value at the mean X=XBar. If you double X, then the predicted value is Y2 = (exp(b0)*XBar^b1)*2^b1 = (Y1)*2^b1. Thus doubling X results in a multiplicative change of 2^b1 in Y. This math is the same for positive and negative values of b1. If instead of doubling X you multiply it by any alpha, then the response changes by alpha^b1.
Thanks for the prompt reply. Basically my work is similar to a paper, which presents the following results of his regression.
“Differences in size, analyst coverage, breadth, trading cost, turnover, and change in breadth are associated with substantive differences in R-square. As an example, a firm with twice the market capitalization of the mean (mean =$1.1 billion) has an R-square ratio that is 18.2% higher, which translates in to an R-square that is 0.023 higher (an R-square of 0.175 versus the mean of 0.152). Doubling breadth of ownership from the mean of 8% to 16% of all institutions yields a 7.5% increase in the R-square ratio,19 which implies an R-square that is 0.009 greater than the mean (0.161). A decrease of round trip trading costs by half from 6.7% to 3.35% yields a similar increase in R-square of 0.01. A difference in turnover of 0.2% is associated with an R-square ratio, which is 4.4% greater, and a R-square which is 0.005 greater than the mean R-square.”
Where,
The interpretation is a bit more challenging because a 1 is added before taking the log. For example, average breadth is
0.081 (8.1%), which means the value for the mean observation is ln(1.081). Doubling breadth to 0.162, means a 7.5%
increase in the value 1.081 (0.075=0.081/1.081). To get the impact on the ratio, multiply 7.5% times the coefficient (0.909), to get a 6.8% increase in the R-square ratio. A 6.8% increase in the R-square ratio results in a 0.009 increase in
R-square.
I am bit confused regarding these lines
"A decrease of round trip trading costs by half from 6.7% to 3.35% yields a similar increase in R-square of 0.01. A difference in turnover of 0.2% is associated with an R-square ratio, which is 4.4% greater, and a R-square which is 0.005 greater than the mean R-square."
here is the link of his paper,
http://citeseerx.ist.psu.edu/viewdoc/download?doi=10.1.1.105.5571&rep=rep1&type=pdf
He interpret his results from the tables given at table I page 43 and table IV page 48.
I am really thankful and desperately needs your help regarding regression results.
I have added one is added to each variable prior to taking the log.
The comment section of a blog doesn't really provide a good platform for a discussion of these issues. I recommend that you post your questions and concerns to the stisitical folks on the SAS Support Group for statistical procedures.
Thanks Rick
Hello Rick
You are doing a wonderful job. Thank you.
Your blogs are really helpful. I need a favour from you. Kindly help me.
I am dealing with a translog cost equation with one dependent and three independent variables. Transformation to stationary series led to emerge negative values for all variables. Log transformation of negative values are not feasible and you have suggested to add a minimum constant to the series. Will it affect the stationarity? Will it affect the analysis? Do I need to back transform data? If yes, then how and when should I back transform it?
In a linear regression, adding constants to variables does not change stationarity, In fact, it doesn't change any of the parameter estimates except for the intercept term
Thank you for the prompt reply. ☺.
Will bother you again in future.
If you have future questions, please post them to the SAS Support Community for Statistical Procedures. I regret that I do not have the time to solve all of the questions that I am sent every day.
Hi Rick
I checked stationarity again after adding a constant to the series and as you mentioned stationarity is not changed. Just wanted to know whether adding constant to the variable will affect regression co-efficient??? I guess it won't but still needs your confirmation. Thanking you in advance.
Do we need to run stationarity test when time series sample is too small say 8-10 years?
You can ask that question at the SAS Support Communities.
when i take log of the variable all values are converted into -.
wats the reason and how can i fix it in eviews?
please help
I'm sorry, but I do not use eviews. I suspect you are taking the log of a nonpositive value and getting a missing value.
Hi Rick,
In my analysis, i take a natural log of total assets of banks which represents "Size". However, the answer i got was in i.e 26.061115 form, can i leave it this way or convert it to 0.26061115? Because all other variables are in later form rather than earlier. Just confuse, i want my result to be more significant than it is right now. thanks
Maybe you are referring to decimal format versus scientific notation? That is,
26.061115 versus 0.26061115 x 10^2.
Computers don't care about the format. The computer represents both these values as an equivalent binary value.
Or maybe you are wondering about percentage (26.06%) versus proportion (0.2606)? Again, it probably doesn't matter. Most statistical analyses will produce the same results. One result will not lead to a "more significant" result than the other.
Thanks so much Rick.
I have a follow up question. Can i use natural log for GDP also considering that the values are in magnitude or i can equally ignore and use percent change (%) instead. thanks
I don't provide modeling advice. However, I have seen many statistical models that use log-GDP, so that seems safe to choose.
Hi Rick,
I have a question and hope you could help me out. I have applied a square root transformation to my DV, and no transformations to my IV. The results indicate that the intercept is 2.30 for my DV and that the coefficient of my IV is 0.1, how do I interpret this. I tried the book of Atkison but I could not accesses it online. I need to hand in my thesis very soon and need an answer to this question. I really hope you can help me out. I have red on several blogs that I should intepret the 0.1 as a percentual increase: for every increase in X the SQRT(Y) increases by 10%. However, I strongly doubt whether this is right.
Let Z = sqrt(Y).
Your regression equation says that the predicted mean of Z at a particular value of X is
Z = 2.3 + 0.1*X
Therefore when X changes by one unit, you should expect Z to change by 0.1 units.
Dear Rick,
Thank you for a fantastic blog!
I have a query that I hope you can answer for me. I am doing analysis on a set of data for 5 subjects (self control). The results are very skewed with values ranging from 1 to 5000 in the first arm and lots of zeros in the second arm. I applied log10 transformation and added 0.1 to the log to perform a t-test. This gave me a negative value of the log for the second arm but a statistically significant result; however when I replaced the addition with 1 (instead of 0.1) it gave me a positive result for the log but not a statistically significant result for the analysis. Is it Ok to use the addition of 0.1 in this case and will the results be acceptable.
Many thanks in advance.
This doesn't sound like a good idea. The traditional two-sample t-test examines the difference between the group means. If you transform the data you are changing the means. For log-transformed data, there is a version of the t-test that examines the RATIO (instead of difference) between the geometric means, but it sounds like you want a traditional t-test.
I think you need to discuss this with a statistician and show him/her the data. Some options include a Satterthwaite test (which does not require equal variances) or a nonparametric test for location. If you are using SAS, you can post your problem to the SAS Support Community.
Thank you Rick. That was a suggestion from a statistician to correct the skewed data!
and it is interesting to hear different opinions. It is actually a paired t-test as it is self control data. To be safe I will use a non-parametric test as you suggested.
Since it is paired data, look at the example in the PROC TTEST doc that I linked to. It assumes lognormal data.
Dear Rick.This is an amazing Blog.
For my undergrad thesis I am doing under the dividend policy.My independent variables are dividend per share dividend yield and Dividend payout ratio.These 3 variables have both the zero value and the positive values.Can you pls advice me to how to do the log transformation on this?Please note that I am using SPSS as my analyzing tool.
Dear Rick....hope this comment reach you in a good health...
I have a question and hope you can help me out....I want to take natural log of data of my variables. one of my variable is net charge off (data from bank annual report), the problem is there is a positive or negative values. e.g. NCO 2005 = -7.97, NCO 2006 = 45.23 and NCO 2007 = 12.66. how can I apply natural log to the negative value? if you could please show me how and give me a figure to see.
You should ask yourself whether it is necessary to transform the data. For most statistical analyses, the data you describe will not cause any problems in the analysis. If you decide that you want a symmetric transformation of positive and negative values, you can use the log-modulus transformation, which handles positive and negative values simultaneously. However, parameter estimates for the transformed data do not have a simple interpretation.
Hi,
I have a dependent variable that includes some negative numbers. I want to log transform it. So I simply re-scaled the dependent variable to 1-100. The I took the natural log. of the re-scaled series Is that allowable?
Any advice would be greatly appreciated.
That seems mathematically valid. An affine transformation just means that you are measuring in different units and using a different baseline. For example, instead of measuring the height above sea level in meters (which might have negative values), you can transform the data so that they measure the height above the sea bed floor in centimeters. The parameter estimates will change, but the data measurements are just as valid in either scale.
Thanks Rick.
So the original dependent variable was from -2 to 12. And I re-scaled to 1-100 to make it easier to think about. Thank you for confirming that it is okay to just log the 1-100 numbers. Right?
I ran the regression using a dependent variable with 3 added (y+3) to make the minimum value 1. I got similar results. Whew!
This is simply an amazing resource.
for the log transformation of time series data ,in excel which function we have to press
ln or log function.
Dear Rick,
your blog and what you are doing is awesome.
My question is referring to Solution 1: Translate, then Transform.
I have a dataset of returns where the lowest is -1.
I would like to do a log transformation to get my data more towards normal distribution.
What value would I add then [ln (1+?)]? And how can I interpret the result?
(Without adding ? I would loose many of my observations)
Thanks for your help
Tobi
There is not one correct answer, but you can add 1.000001. A normalizing transformation does always lead to an interpretable result, especially if it involves a shift parameter. You can say that the new variable is a log transformation of shifted values.
Sir,i have ROA data for 7 years to measure financial performance of a company in relation to likert scale data collected on internal control elements. Now i want to make a regression analysis by using my variables on SPSS version 20. My dependent variable is ROA and the independents are the elements of internal control system. My question is how can i enter my ROA values in the software and regress them against the mean results of my independent variables?Please i need you kind advice.
I suggest that you post your question to a discussion forum for your software.
Hello Sir
I am having negative data for variables like population growth rate and consumer price index. Should i use the method you suggested above - The transformation is therefore log(Y+a) where a is the constant. Some people like to choose a so that min(Y+a) is a very small positive number (like 0.001). Others choose a so that min(Y+a) = 1. For the latter choice, you can show that a = b – min(Y), where b is either a small number or is 1?
Then in such a case, does it apply to the whole dataset?
Yes.
Good day Rick,
Thank you for your info. I am working with bone measurements that are negative and was looking for an option to work with the negative measurements. I was thinking of adding an "a" constant of 10 to my data to shift everything to the right. It doesn't seem to affect the distribution much (this is before log transformation). Do you have a reference where I see similar methods being used so that I can use it for justification in my thesis? Thank you!
You should ask your advisor. For regression models, I reference Chapter 9 of A. C. Atkinson (1985) "Plots, Transformations" and Regression". You can also look at the works cited in the "Reference" section in the documentation of the TRANSREG procedure in SAS.
Thank you for the quick reply. I will take a look at these references. Thank you!
Dear Rick,
What if I choose the constant a such that min(Y+a) is larger that 1? i.e. min(Y+a)=4, or any other higher value. The closer the values are to the zero line, the bigger the log returns get. For the data being too close to zero - does it not make the log returns disproportional and not accurate, if you want to use the log returns for forecasting?
Mathematically, you can choose 'a' however you want. You might have a harder time explaining if you are asked WHY you chose '4'.
Dear Rick, thanks for your post. However, i don't still know how to go about transforming negative gdp growth rate(-0.617851
and -0.307469) for my research using eveiws. Adeleke Abiola from Nigeria. Thanks in anticipation.
Try asking your question on an eviews discussion forum. They might have additional suggestions.
Dear Rick,
Thank you for all your helpful replies and your patience. I have a dataset with a continuous outcome variable (Y) that ranges from -3 to +3 and a categorical predictor (X) variable with two categories (a,b). I'm interested in the percentage change in Y when X changes from a to b. Usually, I would log transform Y and then use a linear model: ln(Y)=beta0+beta1*X. Then the percentage change can be calculated as (exp(beta1)-1)*100. However, since there are negative values in Y, I need to use ln(Y+a)=beta0+beta1*X. My question is: can I still use (exp(beta1)-1)*100 to calculate the percentage change?
Thank you.
Perhaps I am misunderstanding, but I would not transform these data at all. If you fit a linear model to these data, you will get a predicted value for the mean X=a (call the predicted value Y_a) and a predicted value when X=b (call it Y_b). Then the percent change in moving from X=a to X=b is
100% * (Y_b - Y_a)/Y_a
I never really thought along those lines, I was too hung up on the idea that only log transformation of the outcome will give me the percentage change. Thank you!
My data varied from -30 to 54. I have more than 50% negative data. not normally distributed.
May I log transform those data by adding 31?
such as log(31+(-30)), log(31+54)
Is it statistically accepted?
Or what should I do?
Log transformations are usually used when a variable spans many orders of magnitudes. The classic example is the population of cities: some small towns have 10,000 people, large cities might have more than one million. You haven't given much information, but nothing you say makes me think that a log transformation is necessary. Just use the raw data in whatever analysis you are performing. If you have questions, show the data to someone in your company that is statistically savvy.
Hi Rick, I was hoping you could give me some guidance! I am transforming my data in preparation for a principal component analysis. I have 3 variables that I am working with: Elevation, Slope, and Distance to Urban Edge. I have already looked at transforming Elevation and Slope with a log transformation (as that gave me better results than a square root transformation for both scenarios). However, Distance to Urban Edge includes negative numbers (for points within the urban space). I see online that I would need to translate these numbers first before I log transform so that no negative numbers (or 0's) exist, but I am not sure if I would then need to translate the Elevation and Slope variables before log transforming them as well. Does this need to be applied to all variables if it is being applied to one? Any help would be appreciated! Thanks!
No, you would not need to translate the other variables. Bear in mind that log transforms are most useful for quantities that vary over several orders of magnitude. If the Slope ranges over many orders of magnitude, you might consider using arctan(Slope), which is interpretable as the angle in [-pi/2, pi/2] that the slope makes with the horizon.
Thank you so much Rick!!
Hi Rick
I face a problem, which sort of relates to what you write here.
I have a positive outcome measure (distance), which I log-translate using the natural logarithm, to get it normally distributed. Then I run a regression on the log-translated data. This gives me an exposure variable (BMI) with negative values. How do I translate the exposure back to normal values, when they are negative?
The inverse of the natural log transformation is the exponential transformation. The exponential transformation is defined for all real values. You won't have any domain errors in exp(BMI) when BMI is negative.
Dear Rick,
I face a same kind of problem a "K".
I have reaction times, which I log-translate using the natural logarithm, to get it normally distributed. Then I run a regression on the log-translated data.
I translated the values back using an exponential transformation.
My question - how do I account for the standard errors? Should I state their values after the transformation or not?
Thank you!!
This isn't the best place to ask or answer a question like that. For example, it is not clear whether you transformed the dependent variable or the independent variable. To address your question, here is a web site about how to interpret the parameter estimates. The standard errors are harder to interpret. I suggest you present them in the parameter estimates table but do not attempt to transform them.
Dear Sir,
I am doing panel data analysis on my Dependent Variable which is in % also have positive and negative value. Where as my Independent variables (like EPS, ROE) are in % and in absolute number (Include both positive and negative value). Please help me out for the following query:
How to convert large magnitude negative number? (Example Profit -182356)
How to convert dependent variable with negative %? (Example Shareholders Return -14.50%)
Want to say thank you very much for excellent blog
I probably would not transform the explanatory variables (EPS, ROE) unless there is a compelling reason. It is fine to perform regression using negative and positive percentages. Regarding the large numbers in Y, many people change the units of measurement to avoid large numbers. For example, measure profit in millions so that -$182356 becomes -0.182356 when measured in millions of dollars. But again, regression does not care if some values are negative.
Use an internet search engine to search for
assumptions of linear regression site:psu.edu
You will find the assumptions of linear regression. Note that the variables themselves do NOT need to be normally distributed. Only the residuals after fitting the model need be normal. You can use diagnostic plots to assess the normality of the residuals.
Hello Sir,
Your answers are of great help thanks a lot! Meanwhile I have a question. I am planning to make a unit root test on a time series data on inflation. The values vary between 0 and 20 percentage points. Is it logical to take the log transformation of this variable prior to performing the unit root test?
From your description, I do not see any reason to log transform the data.
Dear Sir,
I have a data set in Excel sheet in order to analyse through Eviews. When I try calculate Ln values there are negative numbers in some variables (eg.profit). so what should I do? how I convert negative values in to Ln values?
The article describes two options. A third option is to not transform the data. Talk to your advisor or a colleague to see which option would be best for your data.
Dear Sir,
I have a value -0.03670 for which I want to find the natural log (ln). How should I go about? Please guide.
Sorry, but that is not possible. Assuming that you want a real (not complex) number, logarithms are only defined for positive quantities.
sir
i want to take the natural log by addineg one in the base ,the data is numbers of terrorism incidents.
how can i take it?
plz help me in detaile /
thanku
Take your number, add 1 to it, then take the natural log of the result. Personally, I would take "log base 10," which is the LOG10 button on most calculators.
I have never asked a question on this platform but I like your responses. They are spot on and very well informed.
Thanks so much Rick
Hello Sir,
I have a value -1.430742624 for CPI and i want to transform this value into natural logarithm. When i'm adding 1 to the value, it is still giving me error. So what should i do? How can i convert the negative value into ln in excel?
The logarithm of a negative number is not defined. The logarithm of -1.43 is "undefined" or "N/A".
Dear Sir, my time series data is in ration and when i take the log all the values become negative, can I used it in cointegration and VECM estimation. I mean can i used the log data despite being negative or i used my original data. Thank you
if a positive value is less than 1, then the logarithm will be negative. This is expected and does not cause a problem.
hello sir.I have a value of -11.35 and I want to logtransform it into a positive log.What should I do
Sorry, but the logarithm of a negative number is not defined.
Dear Sir,
Greetings!
I am doing regression analysis where my dependent variable's values are in range (-1 to 1). Now, I want to convert dependent variable's values into range (1 to 5) as dependent variable having values in negative. Log transformation suitable for this or not?
if not suitable then what are other options?
Thank you!
If you want to transform a variable in the range [-1,1] into the range [1,5], you can use the linear transformation
Z = 2*Y + 3.
Hello,
I am looking to try and figure out a way to use an independent variable that has negative values. Ideally, we are looking perform a log-log transform and perform a linear regression on it: ultimately, we want to get the elasticity of the variables.
Considering the coefficient roughly represents the percent change in the variable yields an expected percentage change in the target, I am hesitant about using method 1; the percent changes in the variable would be different than if we had left the values alone which may change the coefficient in the linear regression (for example, if a datapoint goes from 1 to 2, and we add a constant of 1, it now goes from 2 to 3 and the percent change is drastically different). I am also hesitant about using method 2 as we would lose datapoints to be used in the linear regression.
What would you recommend?
Probably the simplest suggestion is to not use "percentage change" as a variable. Consider using the proportion of the original value instead. This is always positive.
For example, if an original measurement is 120 and the current measurement is 90, then the percent change is (90-120)/120 = -0.25. In contrast, prop=New/Original=90/120=0.75.
Hi Rick, sorry to disturb you.
My question also about the same log transformation and negative value calculation. I am using GDPr as my dependent variable but there is one negative value which is effecting my significance result which cannot be log transformed and also I transformed all my data in the independent variable into log. My negatuve value is -1.679, it was on the year 2009 which is just after GFC-2008. How can I make it work (small change or constant) for still getting significance?
Your reply will be highly appreciated....
what is the source of this method of log transformation i mean refference lny=@recode(y>0,log(1+y),-log(1-y))
I do not discuss the log-modulus transformation in this article, but I do discuss it in the article, "A log transformation of positive and negative values," where I provide a reference to John and Draper (1980).
I'm calculating the effect of foreign direct investment on economic growth. Both the FDI and economic growth has negative numbers how do I transform into logs? Foreign direct investment (FDI) calculated as Foreign direct investment (FDI) as a percentage of GDP and economic growth is ((previous - current)/current) x 100
Dear sir,
I have the same question that I had to add a constant to the model before the log log transformation. My data are GDP and BOT. now detranforming made me stucked. how can i detransform the constant? is it should be done before detransforming log log ?
With respect !!!
Your blog is a goldmine of practical tips and actionable advice. I often find myself implementing your suggestions, and they have made a tangible difference in my life.