The Flowing Data blog posted some data about how much TV actors get paid per episode. About a dozen folks have created various visualizations of the data (see the comments in the Flowing Data blog), several of them very glitzy and fancy.
One variable in the data is a categorical variable that specifies whether the actor appears in a TV comedy or a drama. It is interesting to compare the salaries for comedies with those for dramas.
One way to do this is by creating a comparative histogram. In SAS software, you can create a comparative histogram by using PROC UNIVARIATE with a CLASS statement and a HISTOGRAM statement. The ShowType variable is the classification variable; the Pay variable contains the pay per episode for each actor. The following statements create a comparative histogram:
ods graphics on; proc univariate data=TV; class ShowType; histogram Pay / kernel(c=SJPI) endpoints=0 to 13; run; |
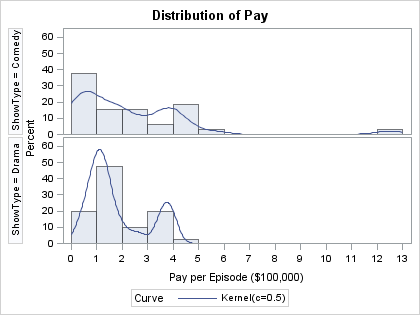
In the example, the bandwidth is chosen by using the Sheather-Jones plug-in method because the default bandwidth selection algorithm seems to oversmooth these data. A smaller bandwidth helps detect the cluster of actors who earn close to $100,000 per episode, and another cluster that earns $400,000 per episode.
I also used ENDPOINTS option to explicitly override the default bin width selection algorithm.
Notice that the comparative histogram automatically labels each histogram according to the value of the classification variable, and automatically equates the scales of all histograms for accurate visual comparison of the distribution of the sample. I can use the same code regardless of the number of categories in the classification variable.
This is the beauty of ODS graphics: the procedures automatically create graphs that are appropriate for an analysis.
Oh, and who is the outlier in the comedy group? That's Charlie Sheen. He makes $1.25 million per episode. I think his show, Two and a Half Men, should be renamed Two and a Half Times the Salary, Man!

1 Comment
Pingback: Visually comparing different data distributions: The spread plot - The DO Loop