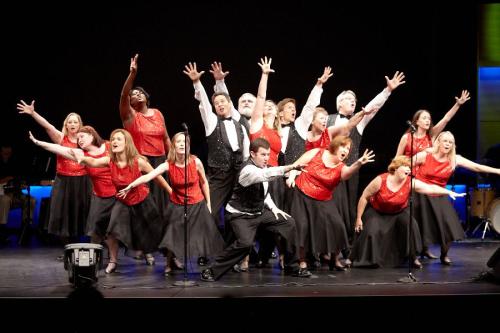
I sing in the SAS-sponsored VocalMotion show choir. It's like an adult version of Glee, except we have more pregnancies and fewer slushie attacks.
For many musical numbers, the choreographer arranges the 20 performers on stage in an orderly manner, such as four rows of five singers. But every once in a while the director wants to create a disorganized look for a portion of a song (for example, a free-form '60's segment). She tells the performers to "go to random positions."
The choir always has problems achieving the look that the director wants. We end up in positions that are equally spaced from one another, but to the audience it often looks like we tried to arrange ourselves in rows, but failed miserably!
Since I know what a random point pattern looks like, I try to help. I whisper "clump more" and "vary the sizes of the gaps between performers." I tell my fellow performers, "random uniform does not imply uniformly spaced," but mostly they just ignore me or roll their eyes.
This year I took it upon myself to solve the problem, and I discovered that it led to some interesting statistics.
The Experiment
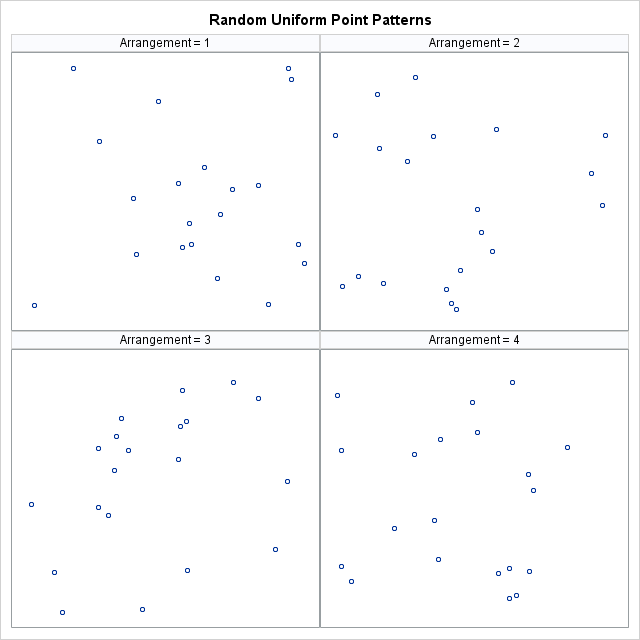
My first attempt to help the director was to generate many examples of random point patterns. Our stage is approximated by the rectangle S = [0, 2] x [0, 1]. It is easy to generate 20 points that are uniformly distributed in S. My idea was that the director would have 10–12 of these patterns. When she wants a random configuration, she can hold up a pattern and say, "go to this configuration." I sent the director the patterns on the adjacent image.
I was quite proud of myself. But guess what?
She didn't like them.
Random Uniform versus Evenly Spaced
The director has been telling us to go to random positions, so how can she not like the random configurations that I sent her? She explained that there are two characteristics that she doesn't like:
- Large areas of the stage are devoid of performers, which I translate to mean "the point patterns have too many gaps."
- Some of the performers are too close to one another, which I translate to mean "the point patterns have too many clusters."
So what does she want?
A Perturbation Algorithm
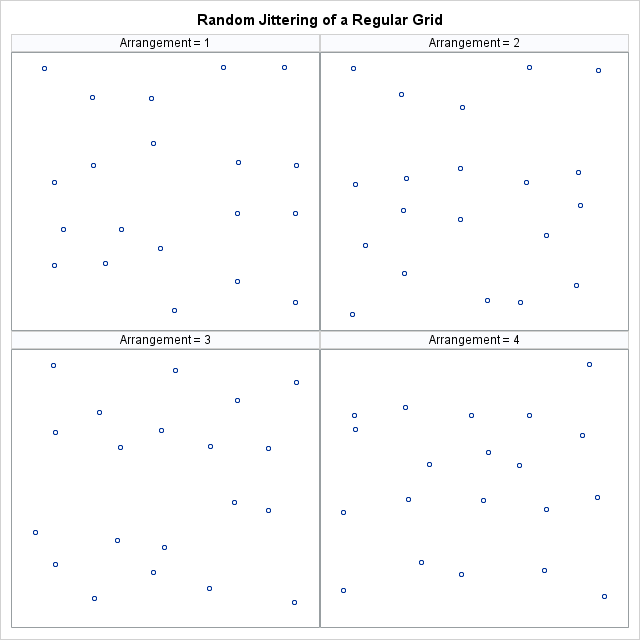
It was time for Plan B. I talked to the director again and heard her say that she wants the performers in a configuration that is close to a regular grid, but not too close. It has to "look random." To me, this suggests a perturbation approach to the problem: start by arranging the performers on a regular grid, but then perturb that arrangement by a small amount.
I thought about how to physically do this on stage and came up with the following algorithm:
- Arrange the performers on a regular grid, such as four rows of five performers.
- Ask the performers to turn in place for 5–10 seconds. Each performer chooses his or her own speed and direction. When the director calls "stop turning," each performer should be pointing in a random direction.
- Each performer takes a step forward in whatever direction he or she is facing.
This algorithm results in a perturbation of a regular grid in which each point is perturbed (jittered) by a small amount in an arbitrary direction. But does this perturbation give the look that my director wants? There's only one way to find out: implement the algorithm and look at some pictures.
Random Jittering of a Regular Grid
Forming a regular grid with SAS/IML software is no problem: I can use the Define2DGrid module, which I have previously described. It is also easy to use the RANDSEED and RANDGEN subroutines to generate angles that are distributed uniformly in [0, 2 pi]. The following SAS/IML module perturbs each position on a regular grid:
proc iml;
/** Module to define ordered pairs that are a random jittering
    of a uniform grid of points.
    The first six input parameters are the same as for Define2DGrid.
    The last parameter, delta, is the size of the jitter.

    Output: Ordered pairs are returned in a matrix with
         (Nx x Ny) rows and two columns.
**/
start GridJitter(XMin, XMax, Nx, YMin, YMax, Ny, delta);
   /** initial placement (grid) **/
   Lx = XMax - XMin; Ly = YMax - YMin;
   dx = Lx / Nx;     dy = Ly / Ny;
   load module=Define2DGrid;
   xy = Define2DGrid(dx/2, Lx-dx/2,Nx, dy/2, Ly-dy/2,Ny);
   x0 = xy[,1];  y0 = xy[,2];

   /** generate random directions in [0, 2 pi] **/
   NPts = Nx * Ny;
   pi = constant('PI');
   angle = 2 * pi * uniform( j(NPts,1) );

   /** each person takes on step in some direction **/
   x = x0 + delta * cos(angle);
   y = y0 + delta * sin(angle);

   /** don't let anyone fall off the stage! **/
   x = choose(xLx, Lx, x));
   y = choose(yLy, Ly, y));
   return ( x || y );
finish;

call randseed(654321);
r = 0.1; /** size of a small step **/
/** jitter 4x5 grid on the "stage" [0,2]x[0,1] **/
Jitter = GridJitter(0,2,5, 0,1,4, r); |
The results of several runs of this algorithm are shown in the following image. I showed the point patterns to the director. "Yes!" she exclaimed. "These are the kinds of configurations that I'm looking for."
Conclusions and Next Steps
One conclusion is obvious. In the initial stages of this project, I violated the Fundamental Rule of Consulting, which is "listen to a client in order to truly understand the problem." I assumed that my notion of "random placement" was the same as my director's, but it wasn't.
I am now excited to begin the next step of this process: a statistical analysis of point patterns.
Regular readers of my blog will recall that one of my New Year's resolutions is to learn something about an area of statistics that is new to me. I've already read a few articles and book chapters that will undoubtedly spark future blog posts about spatial point patterns.
For example, my director emphasized two features of point patterns: clustering and distance between adjacent points. In future blog posts, I will analyze statistics that are associated with these characteristics.
But—shhh!—don't tell the choir that I'm computing these statistics. I'd prefer not to get doused with a slushie.

6 Comments
Trust me Rick, I don't have to tell them you're computing these statistics. They know.
When I was in the show choir, I took great comfort in being told what to do. It's one of the few areas of my life that I was happy to let somebody else direct.
Nice. It should also be interesting to see everyone try to dance after performing your "jitter" algorithm. Hopefully, they won't be too dizzy!
BTW, JMP uses a "jitter" perturbation algorithm for displaying univariate scatterplots, so that instead of seeing the same marker drawn on top of itself 20 times, you see 20 markers slightly jittered apart from each other.
I hope you know what I mean, but I could have been clearer. We randomize once in rehearsal and always go to those same spots every time thereafter. Randomizing in the middle of a show would give the lighting and sound guys fits! And imagine the audience reaction if we all spin in place for 5 seconds! They'd start calling us "Loco-Motion."
Pingback: Divide and count: A test for spatial randomness - The DO Loop
Pingback: Count the number of points in 2D bins - The DO Loop
Pingback: Animate snowfall in SAS - The DO Loop