Computing probabilities can be tricky. And if you are a statistician and you get them wrong, you feel pretty foolish. That's why I like to run a quick simulation just to make sure that the numbers that I think are correct are, in fact, correct.
My last post of 2010 described ways to generate a Christmas gift exchange list for my family. This was motivated by a complaint from a family member, Pam, who had been assigned to give presents to me two years in a row and several times in the last few years. She thought it unlikely that such a situation would occur by random chance. This post estimates the probability of certain events in a Christmas gift exchange by using simulation and compares these estimates to the true probabilities.
Simulating the Christmas Gift Exchange
According to the rules used in my family, Pam gives to one of four people each year. The probability of drawing each name is 1/4. You can use SAS/IML software to simulate the drawing process for Pam. The following statements create a vector x that contains 10,000 random numbers 1–4 with equal probability:
proc iml;
call randseed(4321);
NumSim = 100000; /** simulate this many times **/
p = {0.25 0.25 0.25 0.25}; /** probability that Pam gives to any person **/
x = j(NumSim, 1); /** allocate vector for random results **/
call randgen(x, "Table", p); /** fill with integers 1-4 **/ |
Estimating the Probability of Drawing the Same Name in Consecutive Years
Presumably, Pam wasn't complaining that she had to give to me two years in a row; she was complaining that she had to give to the same person twice in a row. (Some who know me might dispute this claim!) The following statements compute how many times in the simulation Pam gives to the same person twice in a row. There are several ways to compute this quantity. One way is to compute the lag of the vector x and count how many times x and lag(x) have the same value. The LAG function is part of SAS/IML 9.22, but if have not upgraded to the 9.22 release, you can define the following Lag module:
/** module to compute the lag of a column vector
    (not needed for SAS/IML 9.22) **/
start Lag(x, d);
  n = nrow(x);
  y = j(n, 1, .);
  if n >= d then y[d+1:n] = x[1:n-d];
  return( y );
finish;

/** estimate probability that Pam gives to same
    person twice in a row **/
any2 = sum(x=Lag(x,1)) / NumSim;
print any2; |

The Probability of Drawing the Same Name in Consecutive Years
As I expected, the estimate of the probability that Pam gives to someone twice in a row is close to 1/4. You can show that the true probability is exactly 1/4 by enumerating the possible pairs of receivers. Pam can give to the pair 1-1, 1-2, 1-3, 1-4, 2-1, ..., 4-3, or 4-4, and 4 of those 16 pairs represent giving to the same person twice in a row.
Of course, that is only the probability in a given year of Pam drawing the same name as she had last year. My family has been drawing names for the Great Christmas Gift Exchange for 15 years! In that 15 year period, how many times should Pam expect to draw the same name as in the preceding year?
Simulating a 15-Year Period and Estimating the Number of Repeats
As before, there are two ways to answer this question: simulation and probability theory. I am more comfortable with simulation, so I'll start there. You can fill a matrix that has 15 rows and 10,000 columns with random values 1–4 and treat each column as a simulated 15-year period. You can then use the LAG technique to count how many times there were consecutive years in which Pam gives to the same receiver. I predict that the count will be three or four in most 15-year periods, since repeated numbers occur 25% of the time. But some 15-year periods might have zero repeats and a few might have 10 or more. What is the distribution of the number of repeats? The following statements simulate 10,000 15-year periods and count the number of repeated numbers.
NumYears = 15; x = j(NumYears, NumSim); call randgen(x, "Table", p); /** each column is one 15-year simulation **/ results = j(NumSim, 1); do j = 1 to NumSim; results[j] = sum( x[,j]=Lag(x[,j],1) ); end; |
How Many Times Will Pam Give to the Same Person in Consecutive Years?
The results are summarized in the following bar chart. The yellow bars are the percentage of times in the simulated data that a 15-year period contained zero repeats (1.8%), one repeat (8.3%), two repeats (18.2%), and so on. Clearly, the expectation is that Pam will be frustrated three or four times because she has to give to the same person two years in a row. It is perhaps surprising that about 10% of the simulated 15-year periods have six or more repeats! Thus, it is not improbable to have many repeats in 15 years.
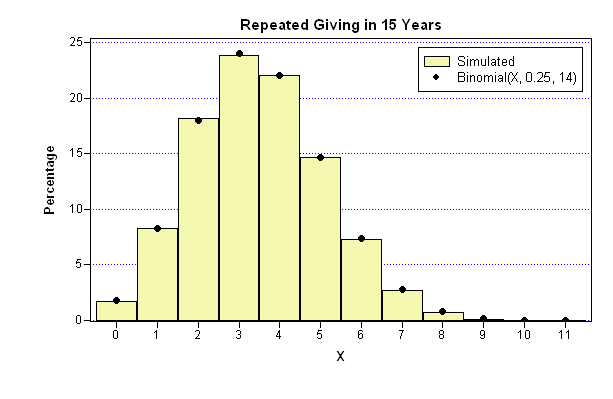
The solid black circles in the bar chart are the true probabilities of having k repeats in a 15-year period when the probability of a repeat is 1/4. You can compute this by using the PDF function in Base SAS software. The following SAS/IML statements use the binomial distribution to compute the probabilities that there are zero, one, two, ..., and fourteen years in which Pam gives to the same person in consecutive years.
match = 0:14;
y = pdf("Binomial", match, 0.25, 14); /** P(success)=1/4, Number of trials=14 **/ |
Notice that there are only 14 pairs of years in the 15-year period. I originally had used 15 for the last parameter of the PDF function (this parameter specifies the number of trials), but I noticed that the probabilities were systematically different than the estimates from the simulated data. When I change the parameter to 14, the discrepancy goes away. If I had not simulated the data, I probably would not have noticed my error.
Notice that I do not need to call the PDF function in a loop in order to compute the probabilities associated with the 15 events. I simply form the SAS/IML vector 0:14 and use that vector as a parameter. The PDF function returns a vector of the corresponding probabilities.
The graph was created by using SAS/IML Studio. You can download the program that simulates the gift exchange and creates the graph.
My conclusions? In a small family that uses random drawings to pick names for a Christmas gift exchange, it is often the case that one family member gives to the same recipient two years in a row. To prevent this, you need to move from a random drawing to a systematic schedule based on permutations.

2 Comments
This looks like exactly what I need--we have a family of 12 (6 siblings and their 6 spouses). I have grown tired of doing it trial and error method on excel (to avoid repeat gift giving in subsequent years) so I would like to try my hand at this (I have done a small amount of programming in college). So what program do I use to run this script?
(Once I get this 12'er to work, I will be able to adjust it for the 12 nieces and nephews to give to each other--but not to their siblings).
Both of these lists will be for 2013 and on, so no rush for this year.
Thanks
Todd
I think this is a great programming problem. The language that I am using is SAS (specifically, the SAS/IML matrix language), but you can take the ideas and implement them in any language such as python or Java. Be sure the language gives you access to a library that generates permutations. Good luck!