My last post was a criticism of a statistical graph that appeared in Bloomberg Businessweek. Criticism is easy. Analysis is harder. In this post I re-analyze the data to present two graphics that I think should have replaced the one graphic in Businessweek. You can download the SAS program that creates the plots for this analysis. The program makes use of the excellent SGPLOT and SGPANEL procedures in SAS 9.2.
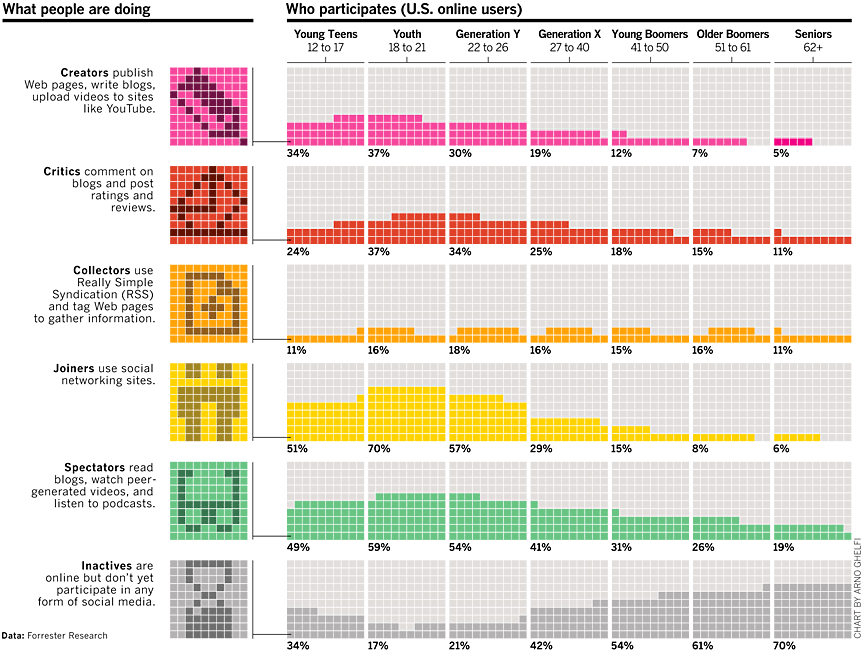
The original graph visualizes how participation in online social media activities vary across age groups. The graph is reproduced below at a smaller scale:
When I look at these data, I ask myself two questions:
- How does participation in social media differ across age groups?
- Given that someone in an age group participates, what is the popularity of each activity?
How does participation in social media differ across age groups?
The answer to the first question is answered by the "Inactives" plot, but the graph is upside down. You can subtract the data from 100 to get the following bar chart.
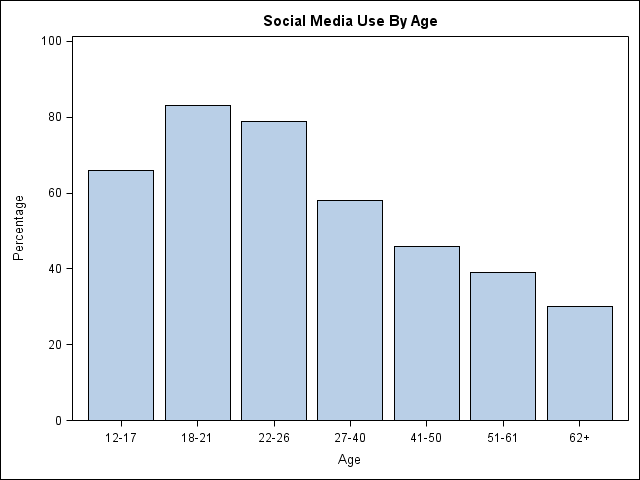
The bar chart shows the percentage of each age group that engages in social media activities. You can clearly see the main conclusion: using social media is highly popular among young people, but older people (in 1997) had not embraced it at the same levels.
This plot should be shown separately from the rest of the data because it shows how each age category is divided into two groups: those that participate in online social media and those who do not. Although it is not apparent by looking at the original Businessweek graph, the last row is distinctly different than the others. The category in the last row is mutually exclusive from the first five categories. Said differently, an "Inactive" individual is represented in a single cell in the last row, whereas an "Active" individual might be represented in multiple cells in the first five rows.
For these reasons, I think you should make one chart that shows participation, and a second chart that shows how people participate.
Absolute Percentages or Relative Percentages?
Look at the last column ("Seniors") in the Businessweek chart. The percentages are for all seniors that are online. This is the wrong scale if you want to determine whether age affects the kinds of the activities that people participate in. Why? Because the previous bar chart shows that participation rates are different across age groups.
Only 30% of seniors participate in any form of social media, so of course the percentage of all seniors that are Critics (11%) is low in absolute terms. But that 11% is actually 37% of the participating seniors (0.37 = 0.11/0.30). In other words, of the seniors who participate in online social media activities, 37% of them are critics. By looking at a relative percentage, you can assess whether participation in a given activity varies across age groups for those who participate.
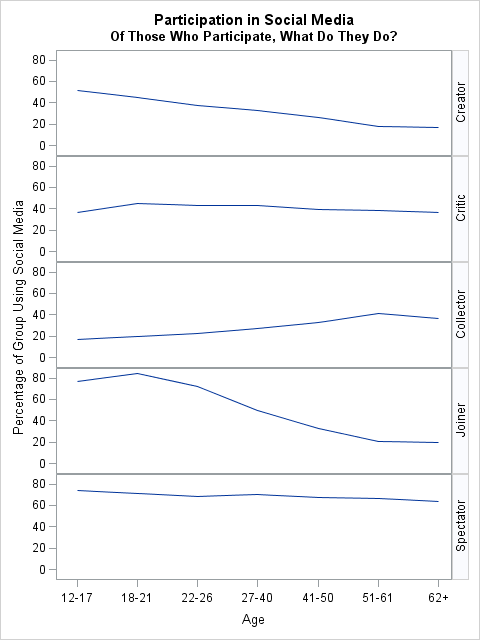
The line plot shows the relative percentages of the data from the Businessweek graph. This plot answers my second question: Given that someone participates, what is the popularity of each activity?
This visualization is more revealing than the "young people are more active" conclusion of the Businessweek graph. Older people who participate in social media are "Critics" and "Spectators" about as often as younger people, and are "Collectors" more often. Only the "Creator" and "Joiner" activities show a marked decrease in participation by older age groups.
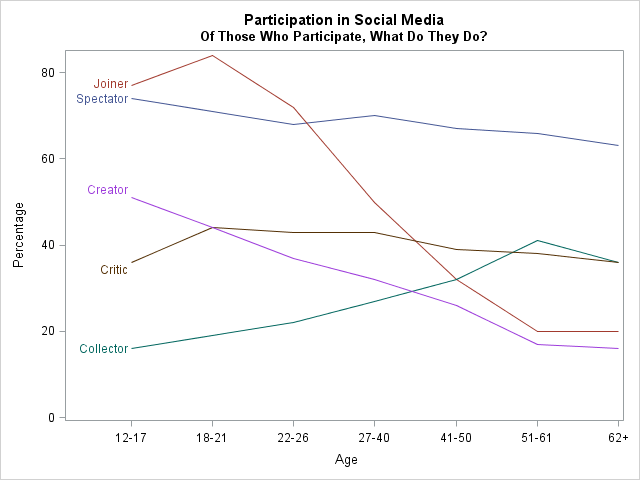
Comparing Participation by Age Groups
There are only five activities to visualize, so it is feasible to create a single line plot that shows how participation in all activities varies across age groups. By placing all of the activities on a common plot, it is easier to determine that the relative percentage of seniors who are "Critics" is the same as the percentage of "Collectors."
Although this graph would never make its way into Businessweek, I think that it—along with the bar chart of social media use by age—tells the story of the data. And isn't that the goal of statistical graphics?

2 Comments
Rick, this is a fantastic follow-up post. It was good to learn some new ways to graphically show stats results.
Pingback: Estimating popularity based on Google searches: Why it’s a bad idea - The DO Loop