Visualizing the distribution of data is a primary task of data analysis. With all the hurricane activity in the Atlantic this year, I’ve been thinking about ways to visualize the historical distribution of hurricane activity.
USA Today on Friday, August 13, 2010, announced that "the heart of hurricane season is here" and displayed a bar chart that looked similar to this:
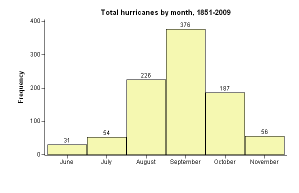
The graph indicates that August, September, and October are times of peak activity for tropical cyclones in the Atlantic basin.
USA Today credits the
National Hurricane Center (NHC) for
the data. The bar chart shows the month in which a storm developed. The bar chart is a coarse visualization of the date on which a cyclone first develops. For example, a hurricane that develops on August 31 would be placed into the August group even if the hurricane continues to churn for eight days in September.
An Alternative Visualization: Using Data from Multiple Days
An alternative way to plot the distribution of hurricanes throughout the year is to count each hurricane multiple times. For the hypothetical hurricane that develops on August 31, you might associate nine observations with the storm: one for August 31, and one for each of the eight days it exists in September. The NHC uses this method to create
an alternative plot that shows the occurrence of hurricanes throughout the year. (Interesting fact:
tropical cyclones in the Atlantic basin last an average of six days.)
Using Data at Six-Hour Intervals
There is yet a third method for displaying the occurrence of hurricanes. The NHC records the position and strength of a hurricane at six-hour intervals, so
you can plot the number of six-hour intervals for which the hurricane was tracked. For example, the NHC reports the following data for Hurricane Earl in 1998:
| Name |
Date |
Time |
Category |
| EARL |
31AUG1998 |
18:00 |
TS |
| EARL |
01SEP1998 |
0:00 |
TS |
| EARL |
01SEP1998 |
6:00 |
TS |
| ... |
... |
... |
... |
| EARL |
08SEP1998 |
0:00 |
TS |
| EARL |
08SEP1998 |
6:00 |
TS |
| EARL |
08SEP1998 |
12:00 |
TS |
For Hurricane Earl, a histogram of the DATE variable would include one observation for 31AUG, four observations for each day in the range 01SEP–07SEP, and three observations for 08SEP. If the width of each histogram bin is one day, the histogram is equivalent to a weighted bar chart, with the weights given by the number of observations for that day. Of course, you can also choose a larger bin width, such as seven days, in order to smooth out daily fluctuations in the data. I haven't seen an example where the NHC uses this technique.
You can create this alternative visualization by using SAS/IML Studio, which is distributed with a SAS data set that contains data on hurricanes in the Atlantic basin from 1988–2003. (You can download the data from the right-hand links of the
SAS/IML Studio product page.) If you exclude observations for weak tropical cyclones (less than 34-knot winds) and plot a histogram of the “day of the year” for each observation, you obtain the following visualization of the distribution of storms throughout the year.
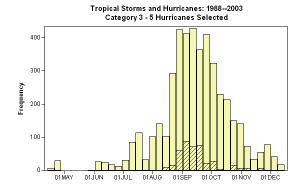
Overall, the effect of this plot is similar to the bar chart that was presented in
USA Today, except that you can see the dramatic increase in tropical cyclone formation in the third week of August and the gradual decrease in activity in October. Notice that this "weighted" graph no longer indicates the total number of storms that occurred during the time period, since each storm contributes multiple observations to the histogram. The "peak of hurricane activity" according to this graph occurs in the second week of September.
The histogram also overlays the distribution of "major hurricanes." A major hurricane is Category 3–5 on the
Saffir-Simpson scale. You can show the distribution of major hurricanes in the SAS/IML Studio histogram by creating a bar chart of the
Category variable and clicking on the bars that represent category 3–5 hurricanes. The major hurricanes correspond to the cross-hatched bars.
Conclusions
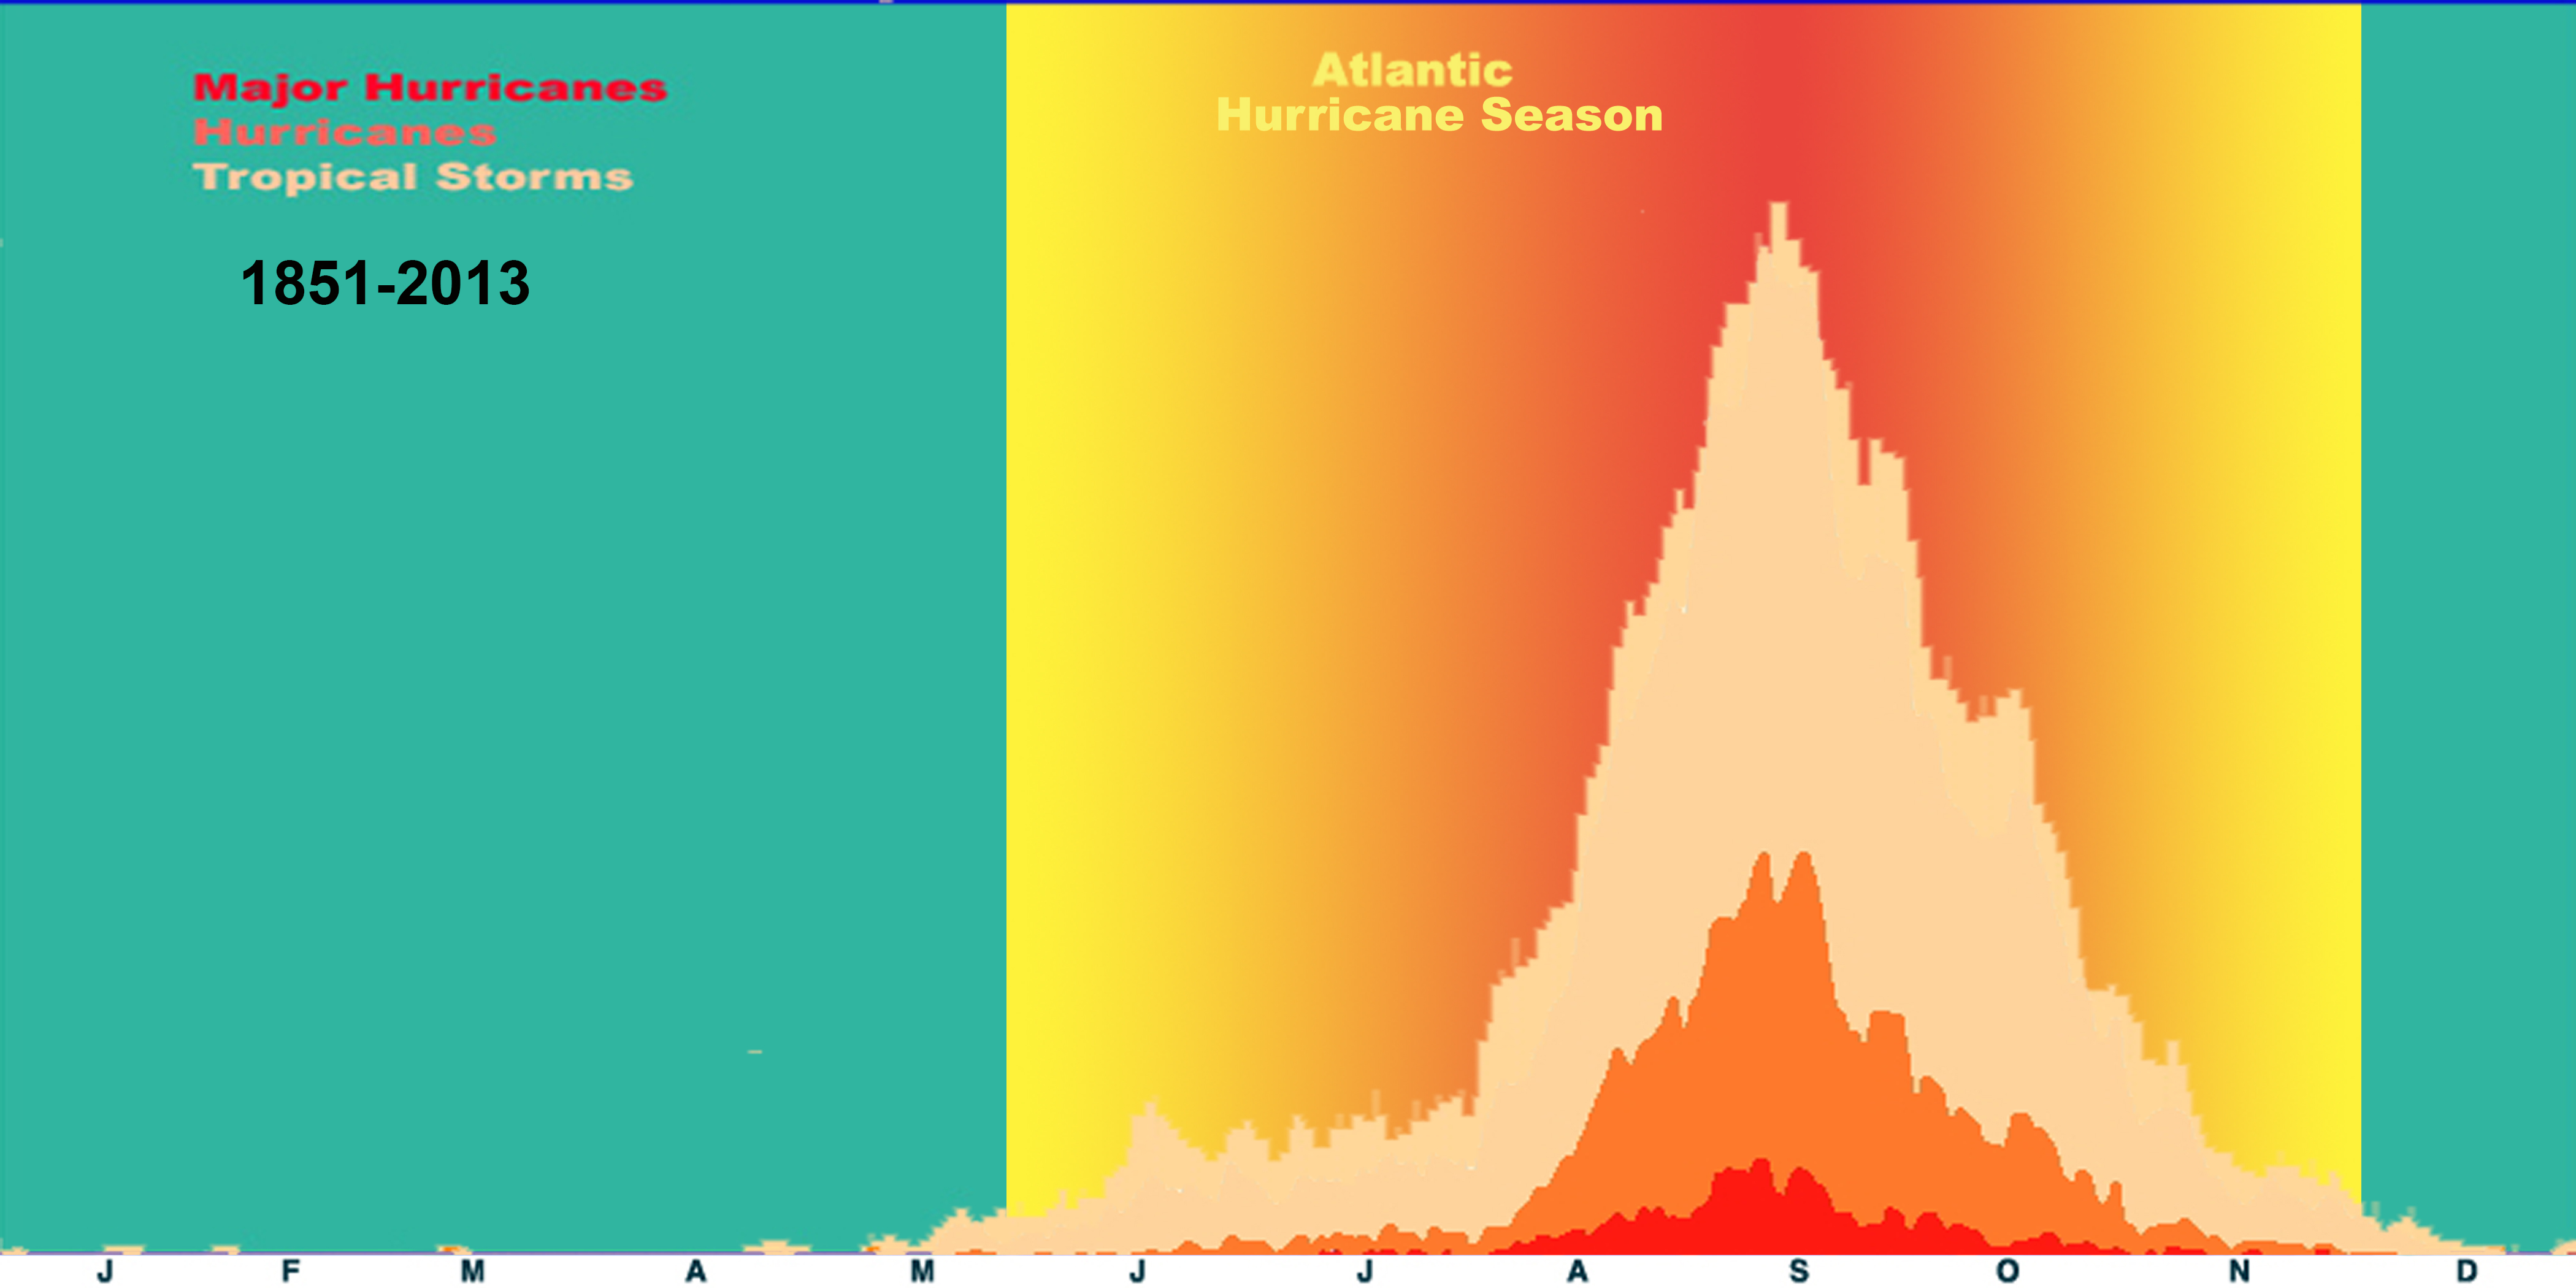
The graph reveals several features in the 1988–2003 data:
- Hurricanes before June are rare.
- The peak of hurricane activity is late August through mid-October.
- Hurricanes continue into November and even early December.
- Major hurricanes are rare prior to August.
- About 1/5 of the storms in the first weeks of September are major hurricanes.
- Major hurricanes have occurred in November, although most major hurricanes occur in late August and in September.

1 Comment
Pingback: Using Data to Define “Hurricane Season” - The DO Loop