We sometimes talk about having trouble ‘seeing the wood for the trees’, meaning that you can get so wrapped up in the detail of what is around you (the trees) that is hard to see that they make a wood. The same goes for data. It is easy to get caught up in the detail, but sometimes you need to step back and look at the whole picture if you are to see it differently.
This may mean some work to set your data out in different ways. But once you can see an overview, new insights will automatically emerge. It’s a way to give your brain a boost.

Example of new insights: Re-thinking fuel as a load
A while ago, one of the Swedish heavy trucks manufacturers presented a really good insight. This is an excellent example of what can happen once you see your data presented in a more effective way.
A large segment of the truck fleet in Europe has an average diesel tank volume of 980 litres. When looking at the lowest residual volume in all trucks, a clear pattern emerged. Only 65% of fuel was actually used before refuelling. So on average, trucks drove around with over 300 litres of fuel that was never used.
So much for the figures, but what about the insight? In other words, so what?
The average unused volume of around 300 litres of diesel is an extra load, resulting in higher fuel consumption. The total fleet fuel consumption was approximately 0.5% higher because of this unnecessary load. In a mature industry with low margins, such as logistics and transport, identifying a possible cost reduction of 0.5% is a very important insight for the truck operator or owner.

But there is more in your data
The total extra fuel consumption, as a result of this heavier load, was 240 million litres, adding up to 500,000 tonnes of CO2 emissions. In other words, this insight is also important environmentally.
All this manufacturer had done was to use data already collected and set it out differently, showing it to people with different areas of expertise. The insights emerged during this process.
Once you get an insight, you can take action to realise the values. In this example, the level of analytics was not particularly complicated, but the possible gains for customers and for the environment were massive.
Insights seem simple once you have them. They just need you to present the data in a way that helps people to understand it. Which means, in turn, that you need to apply some analysis to transform the data into insights.
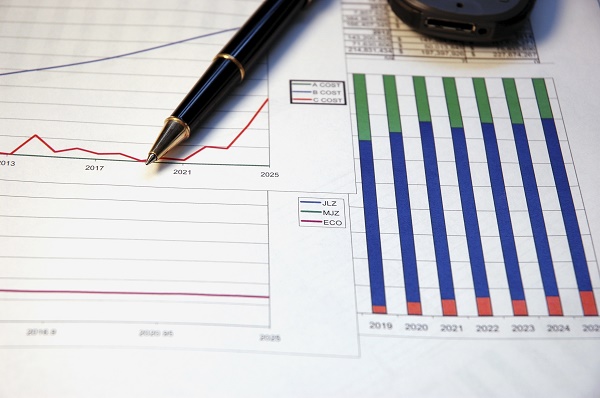
Visuals to help understanding the data
Presenting data visually is a good way to get an overview, and also to make it easier to see. For example, Visual Analytics allows us to use a correlation matrix to explore relationships between variables, and forecasting to figure out which variables explain a response or target variable. The software can make several types of models, but all you really need to know is that they predict future data as a function of historical data values.
Expect more of your data
So what are the lessons from this example? You need to give yourself an opportunity to get an overview of your data. Apply some reasonable analytics, including visuals and modelling. Get some new insights. Then take action to realize the value hidden in your data. It’s that simple.
For your inspiration and new ideas, I recommend our series of articles on using and presenting data in a different way.