Welcome back to the market driven journey in supply chain management! The three earlier articles of this short series contained:
- The typical road to market driven forecasting – where companies go through three different levels of maturity before moving to being market driven
- Market driven forecasting – and the changes it requires from the organization and supporting technology
- Requirements to the supply chain organization in terms of responsiveness, monitoring of flexibility and fast & frequent re-planning.
This final article will outline conclusions from the first three articles, re-visit the key characteristics of being market driven and explain the demand and supply alignment process.
If you missed the previous ones, you find links to them at the end of this post.
Market driven
As stated in the second article – being demand driven deals with three things: Knowing true demand, being able to respond to true demand and having a process in place to align demand and supply.

The keyword for being demand driven is speed. How fast can you identify changes to the demand pattern – and how fast can your supply chain respond to changes in demand. This comes down to the pivotal process of aligning demand and supply.
The demand and supply alignment process
Most literature on the subject of demand planning and forecasting sets up 4-5 different horizons for forecasting processes (here). While long term forecasting and planning is relevant in terms of being market driven, I will focus on the operational forecasting and planning, which deals with the next 4-6 weeks – or longer, if lead times of critical components require so.
The biggest changes from traditional forecasting/planning processes are:
- The use of demand signal analytics to identify demand drivers and forecast error.
- The creation of multiple scenarios to be tested for feasibility and consequences to the supply chain.
- The use of continuous optimisation of inventory and production plan.
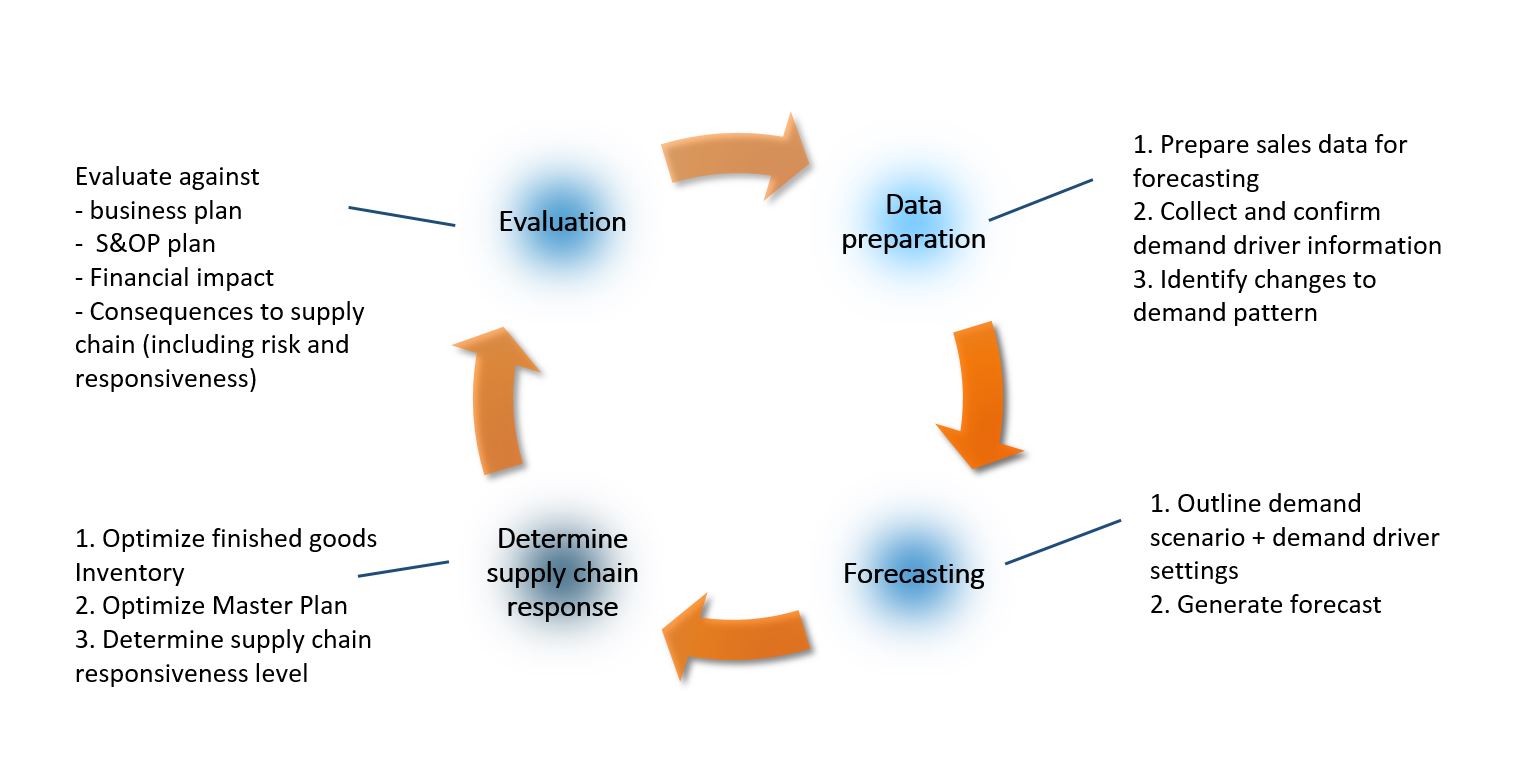
- Data preparation is about collecting, analyzing and preparing data for forecasting. This is probably where the biggest change to the traditional forecasting approaches. Demand Signal Analytics utilizes the power of advanced analytics to identify demand drivers, demand outliers and their explanations. This requires data… many data (imagine a global company testing/using local temperatures or wind as demand drivers).
- Forecasting is about determining a number of relevant forecast scenarios based on different demand driver values (e.g. different price-settings or campaigns). Outlining the demand scenario means to describe reason and feasibility of the demand driver settings. Secondly – forecasts are generated for relevant scenarios and forecast accuracy calculated.
- Determining Supply Chain Response is to use the forecast to calculate an optimised inventory profile, a production master plan, a capacity plan and review these against the current plan to identify changes to inventory and production plans, constraints and risks. Inventory optimisation means re-calculating planning parameters to cope with the future demand situation. Furthermore, the future responsiveness of the supply chain should be determined – how is the ability to increase/decrease supply chain output on short term to align to demand differs from forecast.
- Evaluation is about determining which scenario (and thus which plans) to go for based on the input from the second and third process step. The evaluation should be carried out as a war-room meeting where the forecast scenario and operational response is determined.
Explore how artificial intelligence and machine learning applications are reshaping the supply chain of the future. Tune in to this on-demand webinar
Speed
The forecasting and planning process requires (big) data analysis, forecasting and optimisation. In order to do so, speed is a key parameter to become successful. Developing a Forecasting scenario, forecasting it and subsequently optimising inventory and production should be timed using a stopwatch rather than a calendar. When the initial forecast scenario is created, alternative scenarios typically do not differ much from the initial one, which means forecasting and planning can be done without a complete re-planning.
Time should be spent understanding demand driver influence – i.e. demand signal analytics (DSA).
Demand signal analytics
Demand Signal Analytics is the key to maturing from traditional forecasting to market driven forecasting and thus to knowing true demand. Traditional time-series forecasting breaks the sales history down to three different elements: Trend, Seasonality and noise. Noise in this regard is uncertainty, which turns into forecast error – and it is the main contributor to inventory, excess capacity - and transportation cost. DSA is the ability to investigate dependencies and correlations between different sets of data in order to explain the noise: It can help determine data sets that can explain the underlying reasons for the noise and help predict future demand. This will enable the company know the conditions and circumstances leading to the sales and ultimately answer why and when a customer buys the company’s products. Using DSA, companies can produce forecasts where noise is reduced meaning forecast accuracy is higher.
DSA rests on the ability to store large amounts of data in a demand signal repository (DSR).
The repository is a database that stores demand and demand driver information in a format that allows for easy retrieval so that users can quickly query the database to identify what’s selling, where, when and in what quantities. Identifying marketing opportunities, demand performance, and out-of-stocks. Using that data to perform predictive analytics is where the real benefit (innovation) lies. By considering POS within your data model, you can help identify both current and potential impacts from a sales, marketing and demand planning perspective.
When reading about DSA, the role of Point of Sales data (POS) is often stressed as a key element in understanding true demand. This is true in retail, but, for most manufacturing companies, POS data are not available as they typically do not deliver to the end customer – leaving this opportunity unrealistic. However, I see an increasing desire for manufacturing companies to strengthen end customer relations and potentially bypass wholesalers or dealers with a part of or all of their sales – giving an opportunity to use POS data from this (maybe marginal) part of the sales.
Final notes
The core of being market driven is to use data and analytics as the key to decision making. It means replacing “gut feeling” forecasting with data-driven statistical and visual analysis of demand and demand drivers. It sparks an organisational and a cultural change in the company, where responsibility, competences and relations transforms.
Becoming market driven reduces supply chain uncertainty –leading to a more profitable value chain and better customer satisfaction.
The core of being market driven is to use data and #analytics as the key to decision making. #ConnectedSupplyChain Click To TweetThe entire blog post series is here:
Supply chain transparency: The market driven journey
The market driven journey II – demand driven forecasting
The market driven journey III – the market driven supply chain