Tag: Scatter Plot

Data Visualization
Sanjay Matange 0
Spark lines made easy

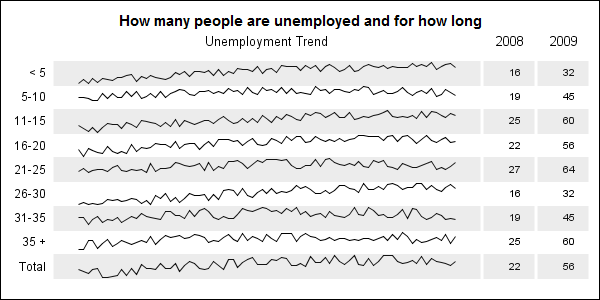
Spark lines, made popular by Edward Tufte, provide a way to visualize trends in a concise space, often inline with the rest of the narrative or data. Previously, I posted an article on Spark Plots in which I created different plot types, some of which included multiple graphs and data in each row.  For such

Data Visualization
Sanjay Matange 2
LFT Panels

CTSPedia.org is a website of Knowledge Base for Clinical and Translational Research.  On this site you can find sample graphs for statistical analysis of safety data for Clinical Research.  Graphs included in this resource have been submitted by contributors, and include a graph for Liver Function for different tests by treatment.

Data Visualization
Sanjay Matange 0
Broken Y-Axis with SAS 9.2

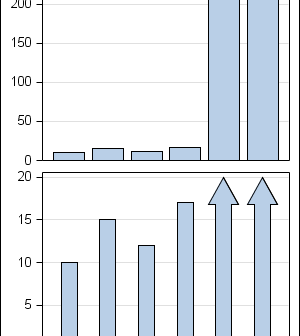
In the previous post on Broken Y-Axis, I reviewed different ways to display data as a Bar Chart, where the response values for some categories are many orders of magnitude larger than the other values.  These tall bars force  the display of other values to be squeezed down thus making it harder to compare

Data Visualization
Sanjay Matange 5
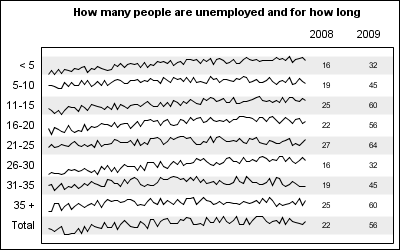
Adding a spark to your data

When viewing time series data, often we only want to see the trend in the data over time and we are not so concerned about the actual data values.  With multiple time series plots, forecasting software can find clusters to help us view series with similar trends. Recently I saw a graph showing the trend of unemployment