Tag: Layout Lattice

Data Visualization
Sanjay Matange 2
Let them eat pie

ODS Graphics system was initially motivated by the need for high quality graphs for SAS Base, STAT, and other analytical procedures.  Use of SG Procedures, ODS Graphics Designer and GTL by users too has initially focused on analytical graphs.  But just like wheels on carryon bags that started for the specific needs of flight

Data Visualization
Sanjay Matange 4
The more the merrier

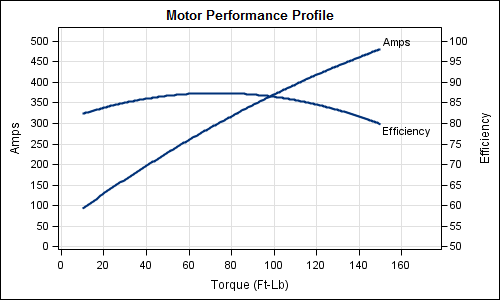
Often it is useful to view multiple responses by a common independent variable all in the same plot.  SGPLOT procedure and GTL support the ability to view two responses, one each on the Y and Y2 axes by one independent variable (X) in one graph.  Yes, you can also have X