Search Results: spaghetti (6)

Data Visualization
Sanjay Matange 5
More on Spaghetti Plots

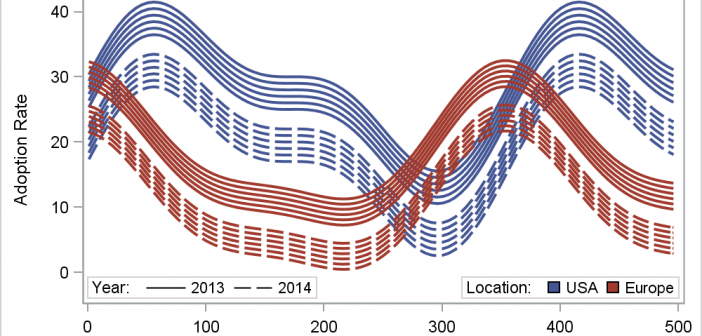
In her article Creating Spaghetti Plots Just got Easy, Lelia McConnell has provided us a glimpse into some new useful features in the SAS 9.4M2 release.  The term Spaghetti plots generally refers to cases where time series plots have to be  identified by multiple group classifications.  The support for the

Data Visualization | Learn SAS | Programming Tips
Sanjay Matange 2
Little things go a long way

In my previous post, I described a new options to control the widths of the caps for Whiskers, Error and Limit bars.  This topic could have been titled "Little things go a long way", as such details really make for a good graph. In a similar manner, another detail issue

Data Visualization
Sanjay Matange 1
Getting Started with SGPLOT - Part 4 - Series Plot

This is the 4th installment of the Getting Started series.  The audience is the user who is new to the SG Procedures.  Experienced users may also find some useful nuggets of information here. Series plots are frequently used to visualize a numeric response on the y-axis by another numeric variable on