Search Results: heatmap (22)

Data Visualization
Pratik Phadke 11
Calendar Heatmaps in GTL

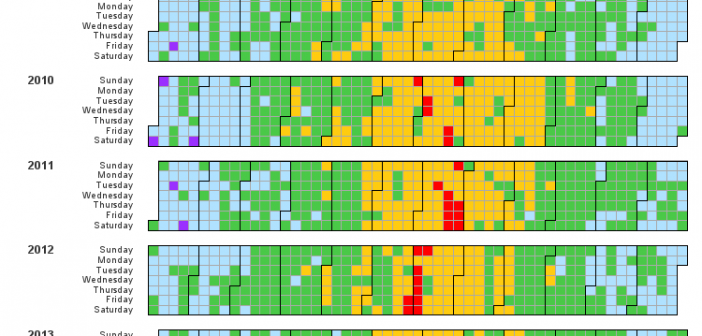
Calendar Heatmaps are an interesting alternative view of time-series data. The measured value is displayed as color mapped cells in a calendar. Calendar Heatmaps can be easily created with SAS 9.3 using just the HEATMAPPARM, SERIESPLOT and BLOCKPLOT statements in GTL and some simple data manipulation. The example below shows

Data Visualization | Learn SAS | Programming Tips
Sanjay Matange 16
A Graphical Journey

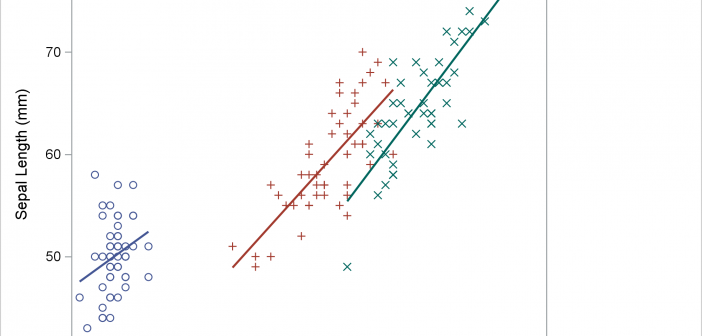
The ODS Graphics software, first released with SAS 9.2, supported creating graphs directly from statistical procedures.  Prior to this, very few statistical procedures created graphs on their own, and in most cases creating graphs was a post process or creating the graphs from the saved data using SAS/GRAPH procedures. With

1 2 3