Search Results: euler diagram (2)

Data Visualization
Sanjay Matange 7
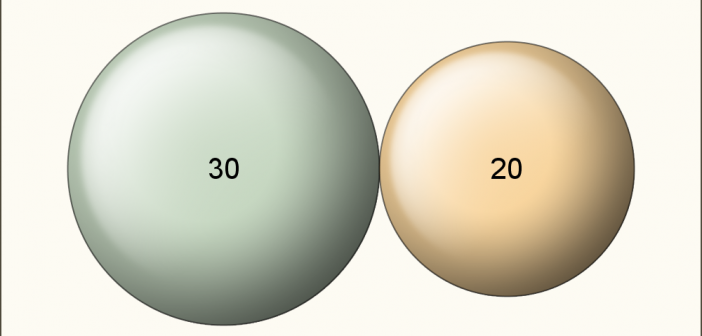
Proportional Euler Diagram

The topic of VENN diagrams had come up a while ago.  At that time, I thought it may be interesting to build a proportional VENN diagram.  But, reading up on VENN Diagrams, I learned that VENN diagrams represent all intersections of N sets, regardless of whether there are actually any observations in one

Data Visualization
Sanjay Matange 0
Splines

Many users of SGPLOT and GTL know how to mix and match various plot statements to create graphs, sometimes in ways not originally intended.  You are also aware that you can go a step beyond, and use these systems to create completely non-standard graphs such as the Spiral Plot, the Polar