Search Results: box and whisker (8)

Data Visualization
Sanjay Matange 4
Box plot legend

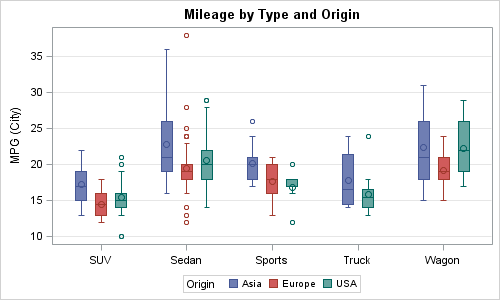
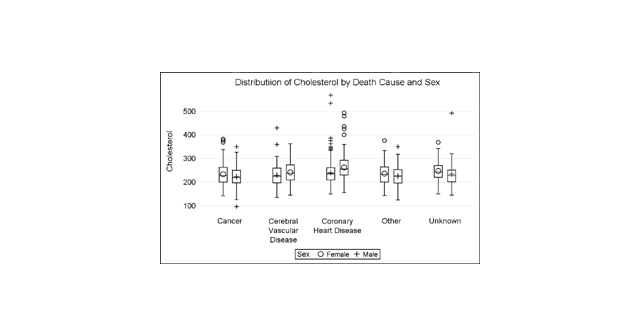
A grouped box plot created by SGPLOT VBOX / HBOX statement or GTL BOXPLOT statement will display groups within categories using group colors and puts the color swatches representing the group values in the legend.  This works well for a color graph created as shown below. title 'Distribution of Cholesterol

Data Visualization
Sanjay Matange 6
Custom Box Plots

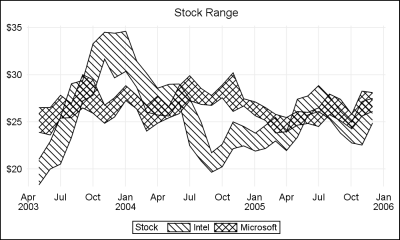
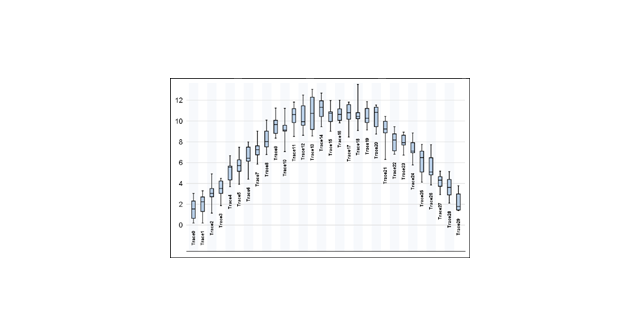
A frequent question we get from users is how to create a box plot with custom whiskers lengths.  Some want to plot the 10th and 90th percentile, while other want the 5th and 95th percentiles.  The VBOX statement in the SGPLOT  procedure does not provide for custom whiskers.  Also, unlike GTL,

Data Visualization
Sanjay Matange 5
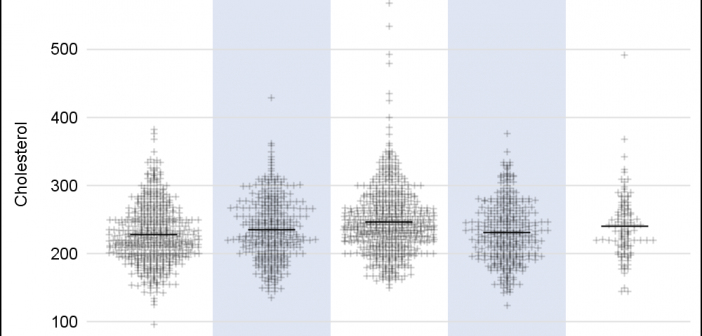
Scatter with mean value

A frequently requested statistical graph is the scatter plot by with discrete categories along with mean value for each category.  Searching for a "Scatter with Mean" will return a lot of requests for such a graph in SAS, Stata, R and other statistical software. Such a graph is very easy