When I write new code, I like to first look at working examples. Graphically Speaking and other sources such as Basic ODS Graphics Examples provide many examples of PROC SGPLOT. Basic ODS Graphics Examples also provides basic GTL examples. The best source of more advanced GTL examples is the library of templates that SAS provides. I will explore various ways to extract and display parts of graph and style templates. These techniques can easily be applied to table and other templates. In the process, I will show you how to use PROC TEMPLATE and the SOURCE statement, PROC SGPLOT with multiple Y-axis tables, create comparable axes in two side-by-side graphs, create a broken axis, write and use a table template that wraps text, and find and display examples of certain statements in graph templates and fonts in style templates.
This first step writes all of the graph templates to a file t.
proc template; source / file='t' where=(type='Statgraph'); run; |
You can supply a product (for example, STAT, QC, or ETS) or a product.procedure (for example, STAT.GLM) before the slash to just store templates for that product or procedure. Other template types include Column, Footer, Header, Link, Style, Table, and Tagset. Case does not matter when you type the template path, but it must match when you type the template type.
This step finds the name of each statement. Special processing is used for IF and ELSE statements.
data t;
   length Term $ 20;
   infile 't';
   input;
   if _infile_ ne ' ';
   last = substr(_infile_, length(_infile_), 1) eq ';' or
          _infile_ =: 'if (' or _infile_ =: 'else';
   term = propcase(scan(_infile_, 1));
   if lag(last) and term ne ' ' then output;
run; |
The next steps count each statement and sort the data set so that the most frequently occuring statements appear first.
proc freq; tables term / noprint out=fs; run; proc sort data=fs; by desending count; run; |
The easiest thing to do at this point is to print the data set.
proc print data=fs(rename=(count=Freq) drop=percent); run; |
We can instead display the results in a graph. You can display the statement names and frequencies in a Y-axis table and also display the frequencies in a bar chart. Since there are 102 different statements, we can rearrange the data to show the most frequently occurring 51 statements on the left and the least frequently occurring 51 statements on the right. The following step rearranges the data and creates two macro variables.
data axistab(keep=y1 y2 y1c y2c y);
   set fs nobs=n;
   call symputx('max', count);
   set fs(where=(term='Scatterplot'));
   call symputx('max2', count);
   do y = 1 to ceil(n / 2);
      j = y;
      set fs point=j;
      y1 = term;
      y1c = count;
      j = y + ceil(n / 2);
      if j le n then do;
         set fs point=j;
         y2  = term;
         y2c = count;
      end;
      else call missing(y2, y2c);
      output;
   end;
   stop;
   format y 2.;
run; |
The first two lines after the DATA statement read the first line of the data, set the variable n to the number of observations, and create a macro variable max that contains the maximum frequency. The next two statements create a macro variable max2 that contains the number of SCATTERPLOT statements. The DO loop first creates the variables y1 and y1c (which contain the most frequently occurring statements and their frequencies) from observation j and y2 and y2c (which contain the lease frequently occurring statements and their frequencies) from observation j+51. These variables are next to each other in the data set and transform the data from 102 observations and 2 variables to 51 observations and 5 variables (including y, the row index). The STOP statement is required since none of the SET statements hit the end of file. Without the STOP statement, the DATA step would continue until one of the SET statements hit the end of file.
The following step creates the graph.
proc sgplot noautolegend; yaxistable y1 y1c / y=y position=left nolabel; yaxistable y2 y2c / y=y position=right nolabel; hbarparm category=y response=y1c / nooutline fillattrs=(color=blue); hbarparm category=y response=y2c / nooutline fillattrs=(color=blue) x2axis; yaxis display=none; xaxis display=none offsetmax=0.25 max=&max; x2axis display=none offsetmin=0.85 max=&max; run; |
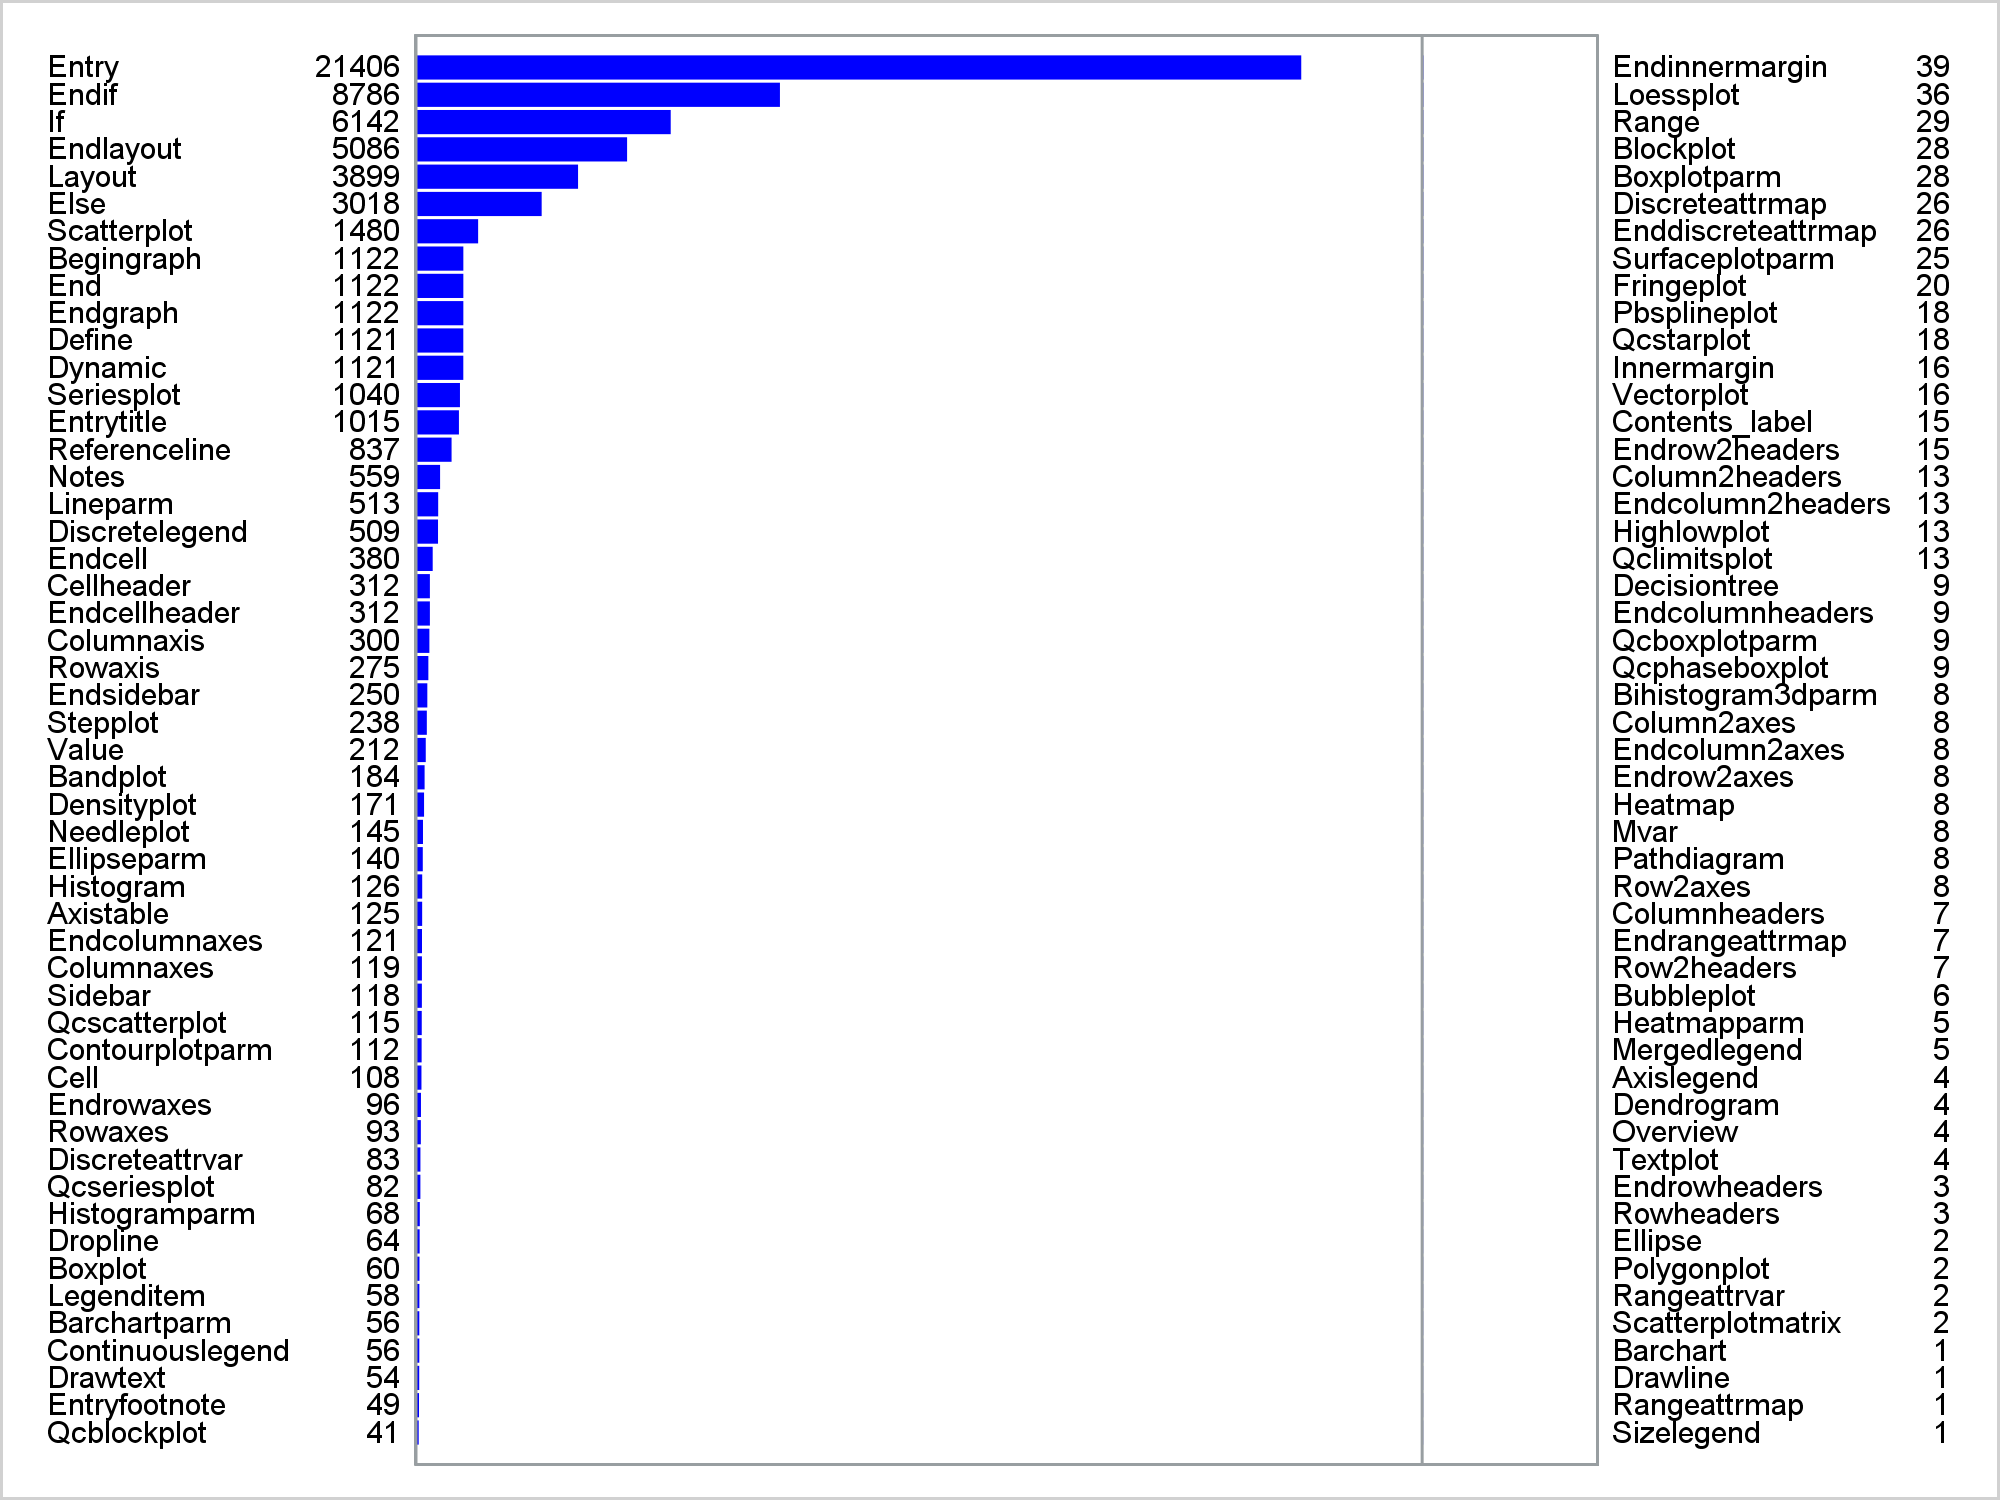
The graph displays two bar charts (one on the left and one on the right). In the graph on the right, the bars are too small to be seen. The left bar chart is wider (because of the OFFSETMAX=0.25 option, which leaves 25% of the horizontal space for the other chart). The right bar chart is narrower (because of the OFFSETMIN=0.85 option, which leaves 85% of the horizontal space for the other chart). The Y=Y options in the Y-axis tables ensure that the row coordinates match the bar chart Y coordinates (CATEGORY=Y). The MAX=&MAX option ensures that the range of both bar charts is consistent. This is why the second bars are too small to be seen. For the bars to truly be comparable, you need both a consistent MAX= value and a consistent axis length (made by consistent offsets).
Since the bar chart for the least frequently occurring statements provides no useful information, you can omit it. Also, since the frequency of the statements that occur more often than SCATTERPLOT are quite large relative to the other frequencies, you can use a broken axis. This way the bars for the smaller frequencies are longer.
proc sgplot noautolegend; styleattrs axisbreak=spark; yaxistable y1 y1c / y=y position=left nolabel; yaxistable y2 y2c / y=y position=right nolabel; hbarparm category=y response=y1c / fillattrs=(color=blue); yaxis display=none; xaxis display=none ranges=(0-%eval(&max2+100) %eval(&max-200)-&max); run; |

The option AXISBREAK=SPARK in the STYLEATTRS statement uses the spark style for the axis break. Other breaks are available too (BRACKET, NOTCH, SLANTEDLEFT, SLANTEDRIGHT, SQUIGGLE, and Z). The RANGES= option in the XAXIS statement controls the ranges on both sides of the break. The values are based on the frequency of the SCATTERPLOT statement and the maximum frequency.
Now imagine that you want to see examples of the BUBBLEPLOT statement. You can start by making a handy template that displays text with wrapping. I have used templates like this one on many occasions. Text breaks on word boundaries at or before column 85.
proc template;
   define table wrap;
      column line;
      define line;
         width=85 print_headers=off;
      end;
   end;
run; |
The next step displays every statement that contains "bubbleplot" anywhere in the statement. Case is ignored.
options ls=85 ps=5000;
%let string = bubbleplot;
data _null_;
   length line stmt $ 32767 tpl $ 120;
   retain p 1 stmt tpl ' ';
   infile 't';
   input;
   if _infile_ ne ' ';
   if _infile_ =: "define statgraph" then do;
      tpl = scan(_infile_, 3, ' ;');
      p = 1;
   end;
   line = left(_infile_);
   last = substr(line, length(line), 1) eq ';' or
          line =: 'if (' or line =: 'else';
   if lag(last) then stmt = line;
   else stmt = catx(' ', stmt, line);
   if last and find(stmt, "&string", 'i') then do;
      file print ods=(template='wrap');
      if p then do;
         line = tpl;
         put / _ods_;
         p = 0;
         end;
      line = stmt;
      put / _ods_;
   end;
run; |
Results:
Stat.Logistic.Graphics.DPCbubble bubbleplot y=_YVAR x=eval (ESTPROB*_FITTEDOBSERVATION) size=C / relativescaletype=proportional sizethresholdmax=_VALUEMAX rolename=(_tip1=_OBSLABEL _tip2=C _id=_ID) tip=(y x group _tip1 _tip2 _id) group=_OUTCOME name="GROUP" index=_INDEX includemissinggroup=false datalabel=_OBSLABEL datalabelposition=top bubbleradiusmin=_BubbleSizeMin bubbleradiusmax=_BubbleSizeMax fillattrs=(transparency=0.6); Stat.Logistic.Graphics.DPCbubblePanel bubbleplot y=DIFCHISQ x=eval (ESTPROB*_FITTEDOBSERVATION) size=C / relativescaletype=proportional sizethresholdmax=_VALUEMAX rolename=(_tip1=_OBSLABEL _tip2=C _id=_ID) tip=(y x group _tip1 _tip2 _id) group=_OUTCOME name="GROUP" index=_INDEX includemissinggroup=false datalabel=_OBSLABEL datalabelposition=top bubbleradiusmin=_BubbleSizeMin bubbleradiusmax=_BubbleSizeMax fillattrs=(transparency=0.6); bubbleplot y=DIFDEV x=eval (ESTPROB*_FITTEDOBSERVATION) size=C / relativescaletype=proportional sizethresholdmax=_VALUEMAX rolename=(_tip1=_OBSLABEL _tip2=C _id=_ID) tip=(y x group _tip1 _tip2 _id) group=_OUTCOME name="GROUP" index=_INDEX includemissinggroup=false datalabel=_OBSLABEL datalabelposition=top bubbleradiusmin=_BubbleSizeMin bubbleradiusmax=_BubbleSizeMax fillattrs=(transparency=0.6); Stat.SPP.Graphics.RawResiduals bubbleplot x=XOBS y=YOBS size=RAWMARK / datatransparency=0.6 display=(outline) outlineattrs=GRAPHDATADEFAULT relativescale=true relativescaletype=proportional bubbleradiusmin=0.15 bubbleradiusmax=3; Stat.SPP.Graphics.ResidualPanel bubbleplot x=XOBS y=YOBS size=RAWMARK / datatransparency=0.6 display=(outline) outlineattrs=GRAPHDATADEFAULT relativescale=true relativescaletype=proportional bubbleradiusmin=0.15 bubbleradiusmax=3; Stat.SurveyReg.Graphics.FitBubble bubbleplot x=XVAR y=YVAR size=WVAR / datatransparency=0.5 name="bubbleplot"; sizelegend "bubbleplot" / orient=vertical location=outside location=outside halign=right; |
PROC LOGISTIC and PROC SPP are the main users of the BUBBPLEPLOT statement. Among other things, the results suggest that BUBBLERADIUSMIN= and BUBBLERADIUSMAX= are important options to consider when making a bubble plot.
You might be wondering (as I did) why there is an MVAR statement in 8 templates. The following displays all MVAR statements. It ignores 'mvar' elsewhere in the statements.
%let stmt = mvar;
data _null_;
   length line stmt $ 32767 tpl $ 120;
   retain p 1 stmt tpl ' ';
   infile 't';
   input;
   if _infile_ ne ' ';
   if _infile_ =: "define statgraph" then do;
      tpl = scan(_infile_, 3, ' ;');
      p = 1;
   end;
   line = left(_infile_);
   last = substr(line, length(line), 1) eq ';' or
          line =: 'if (' or line =: 'else';
   if lag(last) then stmt = line;
   else stmt = catx(' ', stmt, line);
   if last and stmt =: "&stmt" then do;
      file print ods=(template='wrap');
      if p then do;
         line = tpl;
         put / _ods_;
         p = 0;
         end;
      line = stmt;
      put / _ods_;
   end;
run; |
Results:
Qc.Shewhart.Graphics.Layout1 mvar _COLOR _CONTRAST _SYMBOL _PRIORITY _ZONELABEL_SIZE; Qc.Shewhart.Graphics.Layout1_Basic mvar _COLOR _CONTRAST _SYMBOL _PRIORITY _ZONELABEL_SIZE; Qc.Shewhart.Graphics.Layout1_NoInsets mvar _COLOR _CONTRAST _SYMBOL _PRIORITY _ZONELABEL_SIZE; Qc.Shewhart.Graphics.Layout2 mvar _COLOR _CONTRAST _SYMBOL _PRIORITY _ZONELABEL_SIZE; Qc.Shewhart.Graphics.Layout2_Basic mvar _COLOR _CONTRAST _SYMBOL _PRIORITY _ZONELABEL_SIZE; Qc.Shewhart.Graphics.Layout2_NoInsets mvar _COLOR _CONTRAST _SYMBOL _PRIORITY _ZONELABEL_SIZE; Stat.Logistic.Graphics.Roc mvar _ROC_YAXISOPTS_LABEL _ROC_XAXISOPTS_LABEL _ROC_ENTRYTITLE _ROC_ENTRYTITLE2 _ROC_ENTRY_ID; Stat.Logistic.Graphics.ROCOverlay mvar _ROC_YAXISOPTS_LABEL _ROC_XAXISOPTS_LABEL _ROCOVERLAY_ENTRYTITLE; |
Both PROC SHEWHART and PROC LOGISTIC enable you to specify macro variables that then get used in their graph templates.
The following steps write all of the HTMLBlue style template to a file style.tmp along with all of the templates from which it inherits.
proc template; source styles.htmlblue / expand file='style.tmp'; run; |
The following step lists the fonts that are used:
data _null_; infile 'style.tmp' pad; input line $char256.; if find(line, ' graphfonts ', 'i') then f + 1; file print ods=(template='wrap'); if f then put _ods_; if f and index(line, ';') then stop; run; |
It stops when it hits the end of the first CLASS GRAPHFONTS statement.
Results:
   class GraphFonts /
      'NodeDetailFont' = ("<sans-serif>, <MTsans-serif>",7pt)
      'NodeInputLabelFont' = ("<sans-serif>, <MTsans-serif>",9pt)
      'NodeLabelFont' = ("<sans-serif>, <MTsans-serif>",9pt)
      'NodeTitleFont' = ("<sans-serif>, <MTsans-serif>",9pt)
      'GraphDataFont' = ("<sans-serif>, <MTsans-serif>",7pt)
      'GraphUnicodeFont' = ("<MTsans-serif-unicode>",9pt)
      'GraphValueFont' = ("<sans-serif>, <MTsans-serif>",9pt)
      'GraphLabel2Font' = ("<sans-serif>, <MTsans-serif>",10pt)
      'GraphLabelFont' = ("<sans-serif>, <MTsans-serif>",10pt)
      'GraphFootnoteFont' = ("<sans-serif>, <MTsans-serif>",10pt)
      'GraphTitleFont' = ("<sans-serif>, <MTsans-serif>",11pt,bold)
      'GraphTitle1Font' = ("<sans-serif>, <MTsans-serif>",14pt,bold)
'GraphAnnoFont' = ("<sans-serif>, <MTsans-serif>",10pt); |
There might be other fonts that are specified and then later get replaced. The following step list all of the CLASS GRAPHFONTS statements.
data _null_; infile 'style.tmp' pad; input line $char256.; if find(line, ' graphfonts ', 'i') then f + 1; file print ods=(template='wrap'); if f then put _ods_; if f and index(line, ';') then f = 0; run; |
Results:
   class GraphFonts /
      'NodeDetailFont' = ("<sans-serif>, <MTsans-serif>",7pt)
      'NodeInputLabelFont' = ("<sans-serif>, <MTsans-serif>",9pt)
      'NodeLabelFont' = ("<sans-serif>, <MTsans-serif>",9pt)
      'NodeTitleFont' = ("<sans-serif>, <MTsans-serif>",9pt)
      'GraphDataFont' = ("<sans-serif>, <MTsans-serif>",7pt)
      'GraphUnicodeFont' = ("<MTsans-serif-unicode>",9pt)
      'GraphValueFont' = ("<sans-serif>, <MTsans-serif>",9pt)
      'GraphLabel2Font' = ("<sans-serif>, <MTsans-serif>",10pt)
      'GraphLabelFont' = ("<sans-serif>, <MTsans-serif>",10pt)
      'GraphFootnoteFont' = ("<sans-serif>, <MTsans-serif>",10pt)
      'GraphTitleFont' = ("<sans-serif>, <MTsans-serif>",11pt,bold)
      'GraphTitle1Font' = ("<sans-serif>, <MTsans-serif>",14pt,bold)
      'GraphAnnoFont' = ("<sans-serif>, <MTsans-serif>",10pt);
   class GraphFonts
      "Fonts used in graph styles" /
      'NodeDetailFont' = ("<sans-serif>, <MTsans-serif>",7pt)
      'NodeLinkLabelFont' = ("<sans-serif>, <MTsans-serif>",9pt)
      'NodeInputLabelFont' = ("<sans-serif>, <MTsans-serif>",9pt)
      'NodeLabelFont' = ("<sans-serif>, <MTsans-serif>",9pt)
      'NodeTitleFont' = ("<sans-serif>, <MTsans-serif>",9pt)
      'GraphDataFont' = ("<sans-serif>, <MTsans-serif>",7pt)
      'GraphUnicodeFont' = ("<MTsans-serif-unicode>",9pt)
      'GraphValueFont' = ("<sans-serif>, <MTsans-serif>",9pt)
      'GraphLabel2Font' = ("<sans-serif>, <MTsans-serif>",10pt)
      'GraphLabelFont' = ("<sans-serif>, <MTsans-serif>",10pt,bold)
      'GraphFootnoteFont' = ("<sans-serif>, <MTsans-serif>",10pt)
      'GraphTitleFont' = ("<sans-serif>, <MTsans-serif>",11pt,bold)
      'GraphTitle1Font' = ("<sans-serif>, <MTsans-serif>",14pt,bold)
'GraphAnnoFont' = ("<sans-serif>, <MTsans-serif>",10pt); |
The folowing steps show the style names and parents as well.
data _null_;
   infile 'style.tmp' pad;
   input line $char256.;
   file print ods=(template='wrap');
   if line =: "define style" then do;
      line = scan(line, 3, ' ;');
      put // _ods_;
   end;
   if left(line) =: "parent" then put _ods_;
   if find(line, ' graphfonts ', 'i') then f + 1;
   if f then put _ods_;
   if f and index(line, ';') then f = 0;
run; |
Results:
Styles.Htmlblue
   parent = styles.statistical;


styles.statistical
   parent = styles.default;
   class GraphFonts /
      'NodeDetailFont' = ("<sans-serif>, <MTsans-serif>",7pt)
      'NodeInputLabelFont' = ("<sans-serif>, <MTsans-serif>",9pt)
      'NodeLabelFont' = ("<sans-serif>, <MTsans-serif>",9pt)
      'NodeTitleFont' = ("<sans-serif>, <MTsans-serif>",9pt)
      'GraphDataFont' = ("<sans-serif>, <MTsans-serif>",7pt)
      'GraphUnicodeFont' = ("<MTsans-serif-unicode>",9pt)
      'GraphValueFont' = ("<sans-serif>, <MTsans-serif>",9pt)
      'GraphLabel2Font' = ("<sans-serif>, <MTsans-serif>",10pt)
      'GraphLabelFont' = ("<sans-serif>, <MTsans-serif>",10pt)
      'GraphFootnoteFont' = ("<sans-serif>, <MTsans-serif>",10pt)
      'GraphTitleFont' = ("<sans-serif>, <MTsans-serif>",11pt,bold)
      'GraphTitle1Font' = ("<sans-serif>, <MTsans-serif>",14pt,bold)
      'GraphAnnoFont' = ("<sans-serif>, <MTsans-serif>",10pt);


styles.default
   class GraphFonts
      "Fonts used in graph styles" /
      'NodeDetailFont' = ("<sans-serif>, <MTsans-serif>",7pt)
      'NodeLinkLabelFont' = ("<sans-serif>, <MTsans-serif>",9pt)
      'NodeInputLabelFont' = ("<sans-serif>, <MTsans-serif>",9pt)
      'NodeLabelFont' = ("<sans-serif>, <MTsans-serif>",9pt)
      'NodeTitleFont' = ("<sans-serif>, <MTsans-serif>",9pt)
      'GraphDataFont' = ("<sans-serif>, <MTsans-serif>",7pt)
      'GraphUnicodeFont' = ("<MTsans-serif-unicode>",9pt)
      'GraphValueFont' = ("<sans-serif>, <MTsans-serif>",9pt)
      'GraphLabel2Font' = ("<sans-serif>, <MTsans-serif>",10pt)
      'GraphLabelFont' = ("<sans-serif>, <MTsans-serif>",10pt,bold)
      'GraphFootnoteFont' = ("<sans-serif>, <MTsans-serif>",10pt)
      'GraphTitleFont' = ("<sans-serif>, <MTsans-serif>",11pt,bold)
      'GraphTitle1Font' = ("<sans-serif>, <MTsans-serif>",14pt,bold)
      'GraphAnnoFont' = ("<sans-serif>, <MTsans-serif>",10pt);


Base.Template.Style |
The first font listing shows us all we need to know (the fonts in effect). The last listing shows us that the fonts that are used in HTMLBlue are inherited from Statistical. The fonts from Default are overridden. It is much easier to see the font definitions in a display like this than it is by looking at the full source listing of the style.
This step writes all of the style templates to a file.
proc template; source styles / file='style2.tmp'; run; |
This step extracts all of the fonts.
data fonts(keep=font);
   infile 'style2.tmp' pad;
   input line $char256.;
   if find(line, ' graphfonts ', 'i') then f + 1;
   if f then do;
      Font = compress(scan(line, 2, '='), ';');
      if font ne ' ' then output;
      end;
   if f and index(line, ';') then f = 0;
run; |
These steps display the most frequently used fonts first.
proc freq; tables font / out=f(rename=(count=Freq)) noprint; run; proc sort out=f; by descending freq; run; proc print noobs; var font freq; run; |
Results:
   Font                                                                       Freq

   ("<sans-serif>, <MTsans-serif>",9pt)                                        51
   ("<sans-serif>, <MTsans-serif>",10pt)                                       41
   ("<sans-serif>, <MTsans-serif>",7pt)                                        30
   ("<MTsans-serif-unicode>",9pt)                                              26
   ("<sans-serif>, <MTsans-serif>",10pt,bold)                                  25
   ("<sans-serif>, <MTsans-serif>",11pt,bold)                                  17
   ("<MTsans-serif>, Albany AMT",9pt)                                          16
   ("<sans-serif>, <MTsans-serif>",14pt,bold)                                  14
   ("<MTsans-serif>, Albany AMT",10pt)                                         13
   ("<MTsans-serif>, Albany AMT",7pt)                                           8
   ("Calibri, <MTsans-serif>",9pt)                                              6
   ("<sans-serif>, <MTsans-serif>",1.5em)                                       5
   ("<MTsans-serif>, Albany AMT",11pt,bold)                                     4
   ("<MTsans-serif>, Albany AMT",14pt,bold)                                     4
   ("<MTserif-unicode>",9pt)                                                    4
   ("<MTserif>, <serif>",10pt)                                                  4
   ("<MTserif>, <serif>",9pt)                                                   4
   ("<corporate-sans-serif>, <sans-serif>, <MTsans-serif>",10pt)                4
   ("<corporate-sans-serif>, <sans-serif>, <MTsans-serif>",9pt)                 4
   ("Avenir Next LT W04 Light, Helvetica, Arial, Albany AMT",10pt)              4
   ("Avenir Next LT W04 Light, Helvetica, Arial, Albany AMT",9pt)               4
   ("Calibri, <sans-serif>, <MTsans-serif>",10pt)                               4
   ("Calibri, <sans-serif>, <MTsans-serif>",10pt,bold)                          4
   ("<MTsans-serif>, Albany AMT",10pt,bold)                                     3
   ("<serif>, <MTserif>",11pt)                                                  3
   ("<serif>, <MTserif>",9pt)                                                   3
   ("ITC Bookman, <MTserif>",9pt)                                               3
   ("Palatino, <MTserif>",9pt)                                                  3
   ("<MTserif>, <serif>",7pt)                                                   2
   ("<corporate-sans-serif>, <sans-serif>, <MTsans-serif>",7pt)                 2
   ("<sans-serif>, <MTsans-serif>",2em,bold)                                    2
   ("<sans-serif>, <MTsans-serif>, sans-serif",10pt)                            2
   ("<serif>, <MTserif>",10pt)                                                  2
   ("Avenir Next LT W04 Light, Helvetica, Arial, Albany AMT",7pt)               2
   ("Calibri, <MTsans-serif>",7pt)                                              2
   ("Calibri, <sans-serif>, <MTsans-serif>",11pt,bold)                          2
   ("Calibri, <sans-serif>, <MTsans-serif>",14pt,bold)                          2
   ("Calibri, <sans-serif>, <MTsans-serif>",7pt)                                2
   ("Calibri, <sans-serif>, <MTsans-serif>",9pt)                                2
   ("ITC Bookman, <MTserif>",10pt)                                              2
   ("ITC Bookman, <MTserif>",11pt,bold)                                         2
   ("Palatino, <MTserif>",10pt)                                                 2
   ("Palatino, <MTserif>",11pt,bold)                                            2
   ("Trebuchet MS, <MTsans-serif>",10pt)                                        2
   ("_undef_",10pt)                                                             2
   ("_undef_",10pt,bold)                                                        2
   ("_undef_",9pt)                                                              2
   ("<MTserif>, <serif>",11pt,bold)                                             1
   ("<MTserif>, <serif>",14pt,bold)                                             1
   ("<corporate-sans-serif-bold>, <sans-serif>, <MTsans-serif>",11pt,bold)      1
   ("<corporate-sans-serif-bold>, <sans-serif>, <MTsans-serif>",14pt,bold)      1
   ("<sans-serif>, <MTsans-serif>",1.5em,bold)                                  1
   ("<sans-serif>, <MTsans-serif>",10pt,italic)                                 1
   ("<sans-serif>, <MTsans-serif>",11pt)                                        1
   ("<sans-serif>, <MTsans-serif>",14pt)                                        1
   ("<sans-serif>, <MTsans-serif>, sans-serif",10pt,bold)                       1
   ("<sans-serif>, <MTsans-serif>, sans-serif",11pt,bold)                       1
   ("<sans-serif>, <MTsans-serif>, sans-serif",14pt,bold)                       1
   ("<serif>, <MTserif>",12pt,bold)                                             1
   ("<serif>, <MTserif>",15pt,bold)                                             1
   ("<serif>, <MTserif>",7pt)                                                   1
   ("<serif>, <MTserif>",8pt)                                                   1
   ("Avenir Next LT W04 Demi, Helvetica, Arial, Albany AMT",12pt,bold)          1
   ("Avenir Next LT W04 Demi, Helvetica, Arial, Albany AMT",14pt,bold)          1
   ("ITC Bookman, <MTserif>",11pt)                                              1
   ("ITC Bookman, <MTserif>",12pt,bold)                                         1
   ("ITC Bookman, <MTserif>",15pt,bold)                                         1
   ("ITC Bookman, <MTserif>",7pt)                                               1
   ("ITC Bookman, <MTserif>",8pt)                                               1
   ("Palatino, <MTserif>",11pt)                                                 1
   ("Palatino, <MTserif>",12pt,bold)                                            1
   ("Palatino, <MTserif>",15pt,bold)                                            1
   ("Palatino, <MTserif>",7pt)                                                  1
   ("Palatino, <MTserif>",8pt)                                                  1
   ("Trebuchet MS, <MTsans-serif>",11pt,bold italic)                            1
   ("Trebuchet MS, <MTsans-serif>",11pt,bold)                                   1
   ("Trebuchet MS, <MTsans-serif>",11pt,italic)                                 1
   ("Trebuchet MS, <MTsans-serif>",12pt,bold)                                   1
   ("Trebuchet MS, <MTsans-serif>",15pt,bold)                                   1
   ("Trebuchet MS, <MTsans-serif>",8pt)                                         1
   ("_undef_",11pt,bold)                                                        1
   ("_undef_",14pt,bold)                                                        1
("_undef_",7pt) 1 |
If you want to modify fonts, it might be handy to see which fonts are most often used in the styles that SAS provides.
In summary, I sometimes find it handy to write template source code to a file and process it. For example, when we added BY group support to templates, I modified all of the graph templates by writing a DATA step that read all of the template files and then added the relevant DYNAMIC, IF, ELSE, ENTRYTITLE, and ENTRYFOOTNOTE statements. Then I used PROC TEMPLATE and the SOURCE statement along with subsequent DATA step processing to check my results. I also use PROC TEMPLATE and the LIST statement to track the names of templates and their item stores. You can use these techniques to see examples of the template code that SAS provides.
