Long category values occur frequently in real world use cases. This can happen with graphs for analysis of clinical research data, and also for graphs showing survey data where the question asked may be long (even a paragraph). Managing such long categories on the x or y axis is always a challenge.
With the SAS 9.4 release, SGPLOT and GTL support many features to help manage long category values by splitting and wrapping the value to fit in the space for each category. On the x-axis, the space for each category is limited by the number of categories. By default, the SGPLOT procedure will split the categories on a "white space". An option is also available to set the split character(s) which may be necessary in some cases for international use cases, or for categories without white space (such as URLs).
Often, it is helpful to position the categories on the y-axis. This provides a more efficient layout for long categories. In a recent article, I showed some features useful for graphs with long category values. Many of you commented on the need for finer control of splitting and wrapping. I will address some available features here.
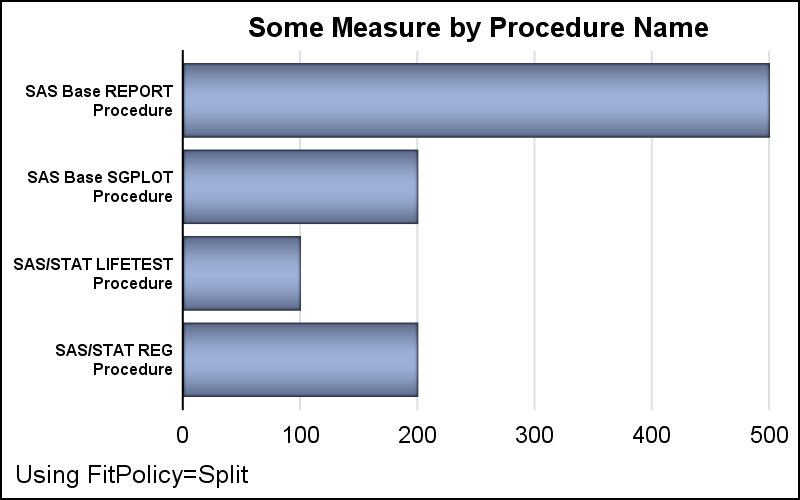
The graph below shows the default behavior of splitting of the y-axis values when using FITPOLICY=Split. Using this feature, the tick values are split at a "white space" to provide the best fit for the value, utilizing about 25% of the width of the graph for splitting. If Y and Y2 axis are in use, both will use up to about 25% each . Note, I have reduced the size of the y-axis values font a bit. The footnote provides information on options used. See link at the bottom for the full code.
Now, you may want better control over the split point in the values. This can be done by inserting a custom split character in the value, and instructing the software to split on the presence of this character. For the graph below, I have added a ":" after the SAS product name, and used SPLITCHAR=":" Note, now the values are all split only after the ":". Also, the split character is dropped from the display when split occurs. You can provide multiple characters in the string. Split will occur at each character.
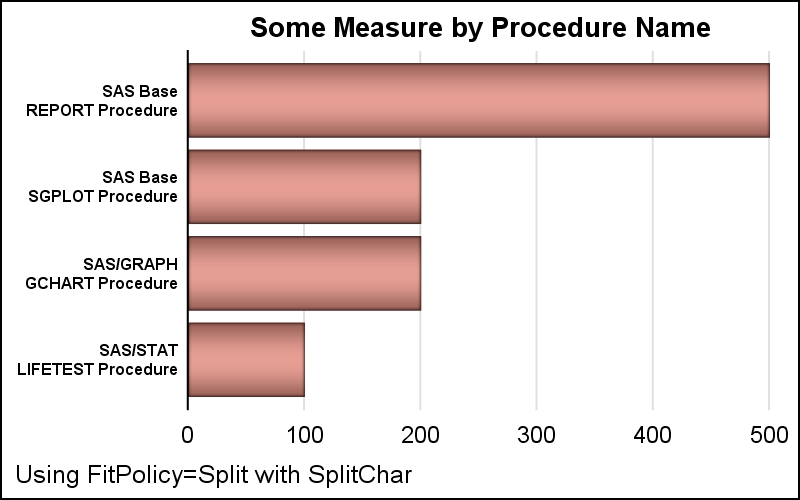
In the case above, since I provided only 1 ":" character in each category value, only one split will occur. If the tick value is still too long it will take space away from the bar chart.
Another useful option is the SPLITCHARNODROP. This option instructs to RETAIN the split character in the display. In the graph below, I have used this option. Note, the ":" after the product name are now retained.
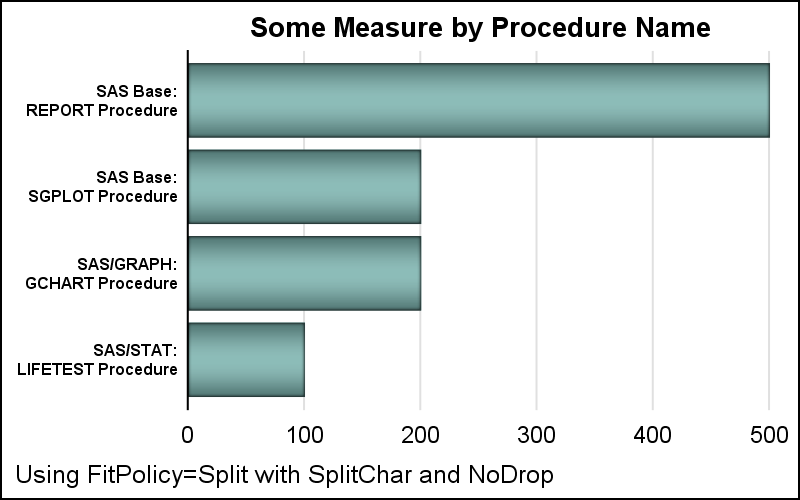
This option can be very useful when the y-axis category values are URL links. Providing SplitChar="." allows these long strings to be split and wrapped at the appropriate "." while still retaining the "." in the URL string.
SGPLOT Code: Split


5 Comments
Reminds me of the PROC PRINT SPLIT='split-character' option... is that where SPLITCHAR option stemmed from? I also like the SPLITCHARNODROP - handy to have the option so the split character can be retained. Useful and flexible options!
Yes, we try to keep some consistency within and across procedures. I am sure this was influenced by some previous usage. Glad to know you could find these useful.
What am I doing wrong with SGPLOT? When I add the SCATTER statement to my SERIES and REFLINE statements my graph area shrinks. This seems to be happening when I introduce the SPLITCHAR option for a data point label.
Please help!
Without seeing the plot, my guess is that some of your data labels are pretty long, and axis offset is adjusting to accommodate for the possibility of the labels being on the end values. You can work around this by setting the axis offsets yourself using the OFFSETMIN and OFFSETMAX options on the XAXIS statement. Let me know if this helps.
This worked! I had to apply OFFSETMIN and OFFSETMAX options to both the XAXIS and XAXIS2 statements.
Sanjay's paper was my guide: https://support.sas.com/resources/papers/proceedings11/281-2011.pdf
Thanks!