A few days ago, I posted an article on displaying first N bars from a data set. This is useful when the data is sorted by descending response, and only the first few values are significant. There were a few interesting comments, including one that was regarding the treatment of long category values. That comment motivated me to write up this article on ways to deal with graphs having long category values.
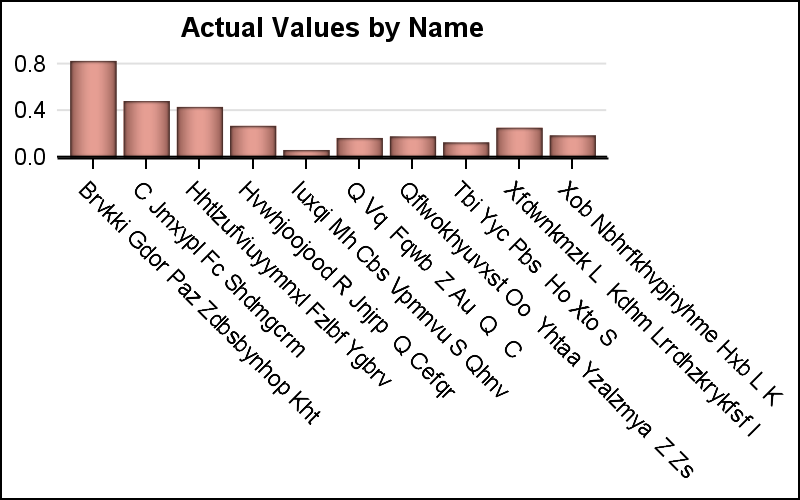
When we have a bar chart with long category values, the SGPLOT default x-axis behavior is to split the tick values on white space to create a nice readable graph. However, sometimes the text string can include long words without breaks. In such a case, the x-axis displays the values at a 45 degree angle as shown below. For this article, I generated some random long labels (max 40 characters) with white spaces.
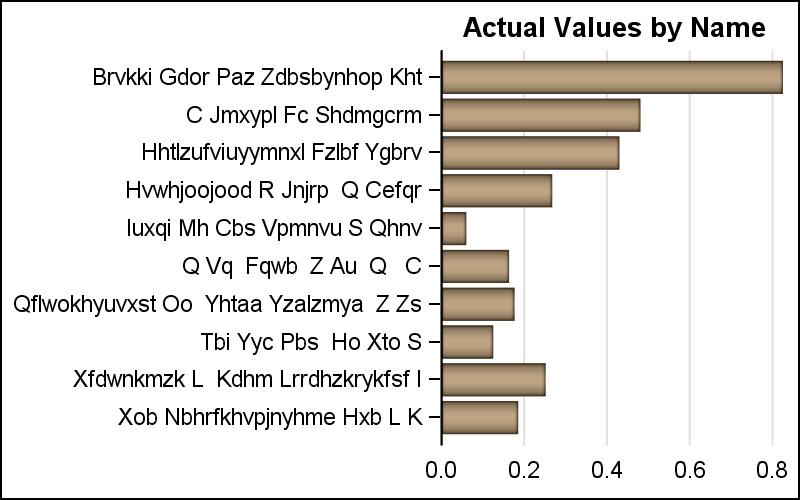
In such a case we can use an HBAR, to display the categories on the y-axis. This often results in a better graph, with long category values displayed on the y-axis.
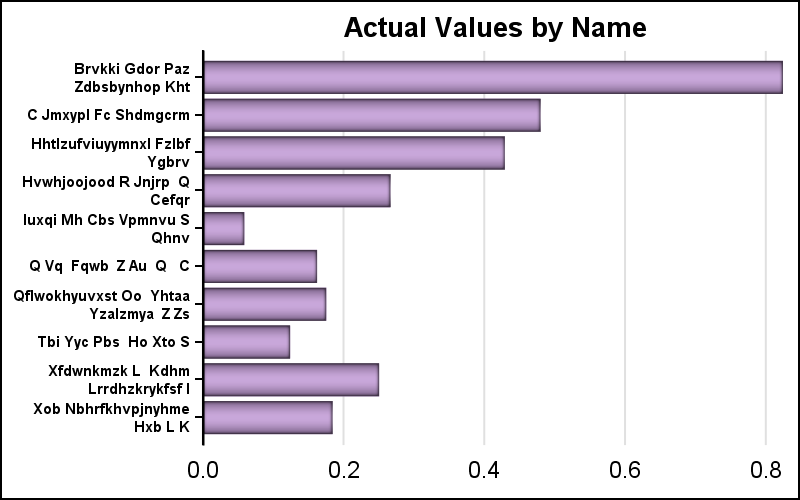
The y-axis tick values do not split automatically even when white space is present in the text strings. However, one can use the FITPOLICY=SPLIT option on the y-axis to split the values to the y-axis uses about 25% of the width of the graph. Note, extra space is not automatically created to fit the wrapped text without overlapping. So, one has to customize the graph by reducing font size, or increasing the graph height.
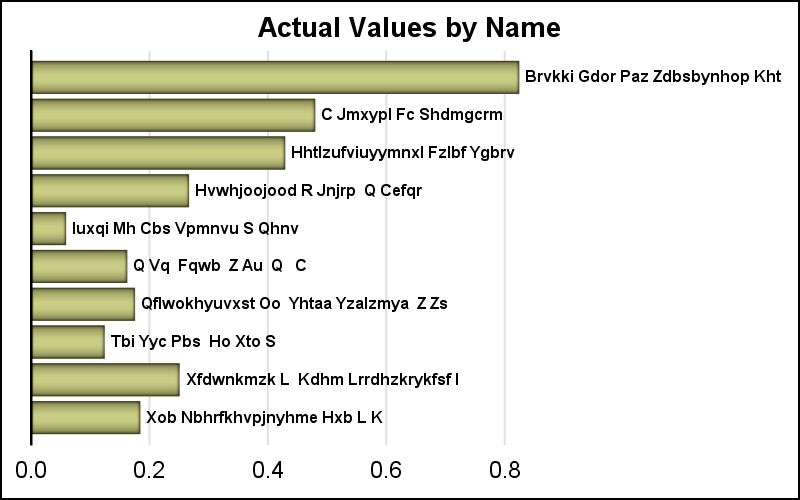
Another way to address this issue is by dropping the y-axis tick values entirely, and using bar labels to display the category values. This could be more efficient in using the space, especially if the longest bar does not have the longest label. In the graph below, I have disabled the display o f the y-axis values, and displayed the same using the DATALABEL option.
Finally, we come to a new feature that will be released with SAS 9.40M5 SGPLOT procedure and GTL. This new option requests the graph to preferably place the data labels inside the bar if they fit. Using this option, we get the graph below. I have also sorted the bars by descending response.
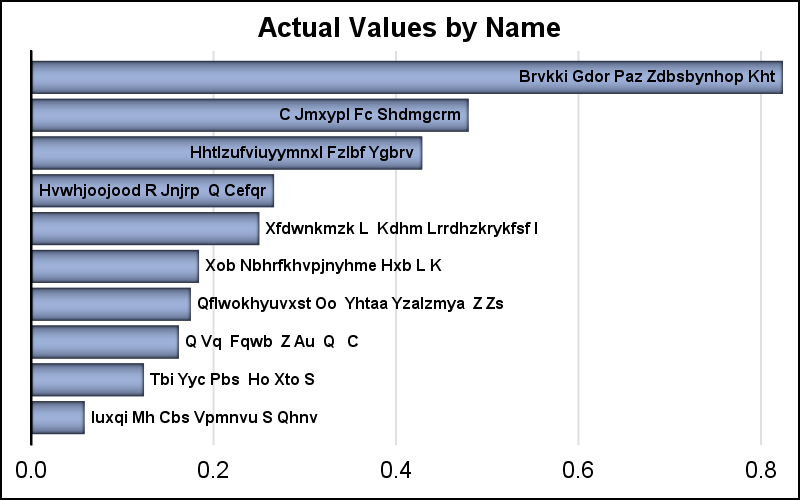
The first four bars are able to fit the bar label inside the bar. So, additional space does not need to be reserved for these longer bars. As the bars get shorter, some of the data labels that do not fit inside the bar are displayed outside the bar to the right.
This new option is only available only for the HBAR. This may allow us to reduce the width needed for some graphs. This option is provided to manage the space used by data labels, and it is not necessary to display the categories as data labels. I will document this option once SAS 9.40M5 is released.
Full SGPLOT code: Long_Cat_Values

9 Comments
Thanks Sanjay, nice tricks. Also your previous post of using xaxis table and n < is nice. Old fashoined way of using formats also works but is more cumbersome.
One challenge is that a lot of the nice features that you add in SG gRaphics is not really benefitting customers as people are afraid to upgrade from M2-M3-M4 because of especially problems in the webtier. Is there a way to do oldfashined patches for the SG procedure?
It is good you think the new features would be useful. We realize there is a delay before users can upgrade to a new SAS release. This is even more so in the Pharmaceutical domain. However, when you do upgrade, you will know these features exist, and can use them.
We have long category labels and I generally plot them to the left on a horizontal graph. Sometimes they are still too long! Splitting at a space is not the ideal solution because the labels have some internal structure and they are easier to read if split at a semantic break.
.
Is it possible to specify a character other than space for splitting? A better (additional) solution would be to honour the special Unicode characters designed for this purpose: see "The Unicode line breaking algorithm" at http://unicode.org/reports/tr14/ . Some consistency across all SAS products and procedures would be welcome here.
Yes. You can use the y-axis FITPOLICY=split or splitAlways and specify a split character that can be put in the string. For example, your category could be "SAS/STAT. REG Procedure". Now, you can use SPLITCHAR='.' to always split after "SAS/STAT", thus predictably splitting where you want. You are free to use the special character if you want. Sometimes, using a character from the Latin character set is easier.
Thanks for the explanation. The Unicode standard is more sophisticated than just splitting on a single character. It includes hyphenation and distinguishes forced and optional splits. The special characters have zero width when they are not having a splitting effect. Support for this standard would be welcome.
Sounds like a good idea. Thanks Peter.
It would be great to see a feature that allowed one to increase the width of the bars (i.e. width would be the max to accommodate the longest wrap) and control wrapping at a particular point or points. In the example shown, I wouldn't mind if the graph was taller to add the space necessary to achieve more control over the output. The wrapping at points could be controlled by ODS functions (like ^{NEWLINE 1}). I really like the inner bar annotation, but not so much the mix of inner and outer. It's still a fabulous enhancement and I can't wait for M5 for a number of reasons!
Thanks for your feedback. As mentioned in the previous comment, you can control the wrapping where you want by specifying the split character. I will add an example to this article. Note, while the InsidePreferred feature is new, the other features for splitting of tick values are released with SAS 9.4.
Pingback: Tips and Tricks: Managing long category values - Graphically Speaking