SG annotation is a powerful technique that enables you to add text, lines, arrows, shapes, and images to graphs. Most of the time, you can use an analytical procedure with ODS Graphics enabled, an SG procedure such as PROC SGPLOT, or the GTL and PROC SGRENDER to create the graph you need without needing SG annotation. However, SG annotation enables you to create highly-customized graphs, so it is important that you understand how to use it, how it is different from using a SAS procedure, and how to find your mistakes when your data set is not correct.
If you are not familiar with SG annotation, search Graphically Speaking or the web for "SGANNO" or "SG annotation". I found 23 posts that matched "SGANNO". Start with Dan Heath's post Graphical Swiss army knife and paper Now You Can Annotate Your Statistical Graphics Procedure Graphs.
Here is an example of one of the smallest possible SG annotation data sets along with a PROC SGPLOT step that uses it.
data anno; function = 'text'; label = 'Class Data Set'; run; proc sgplot data=sashelp.class sganno=anno; reg y=weight x=height; run; |
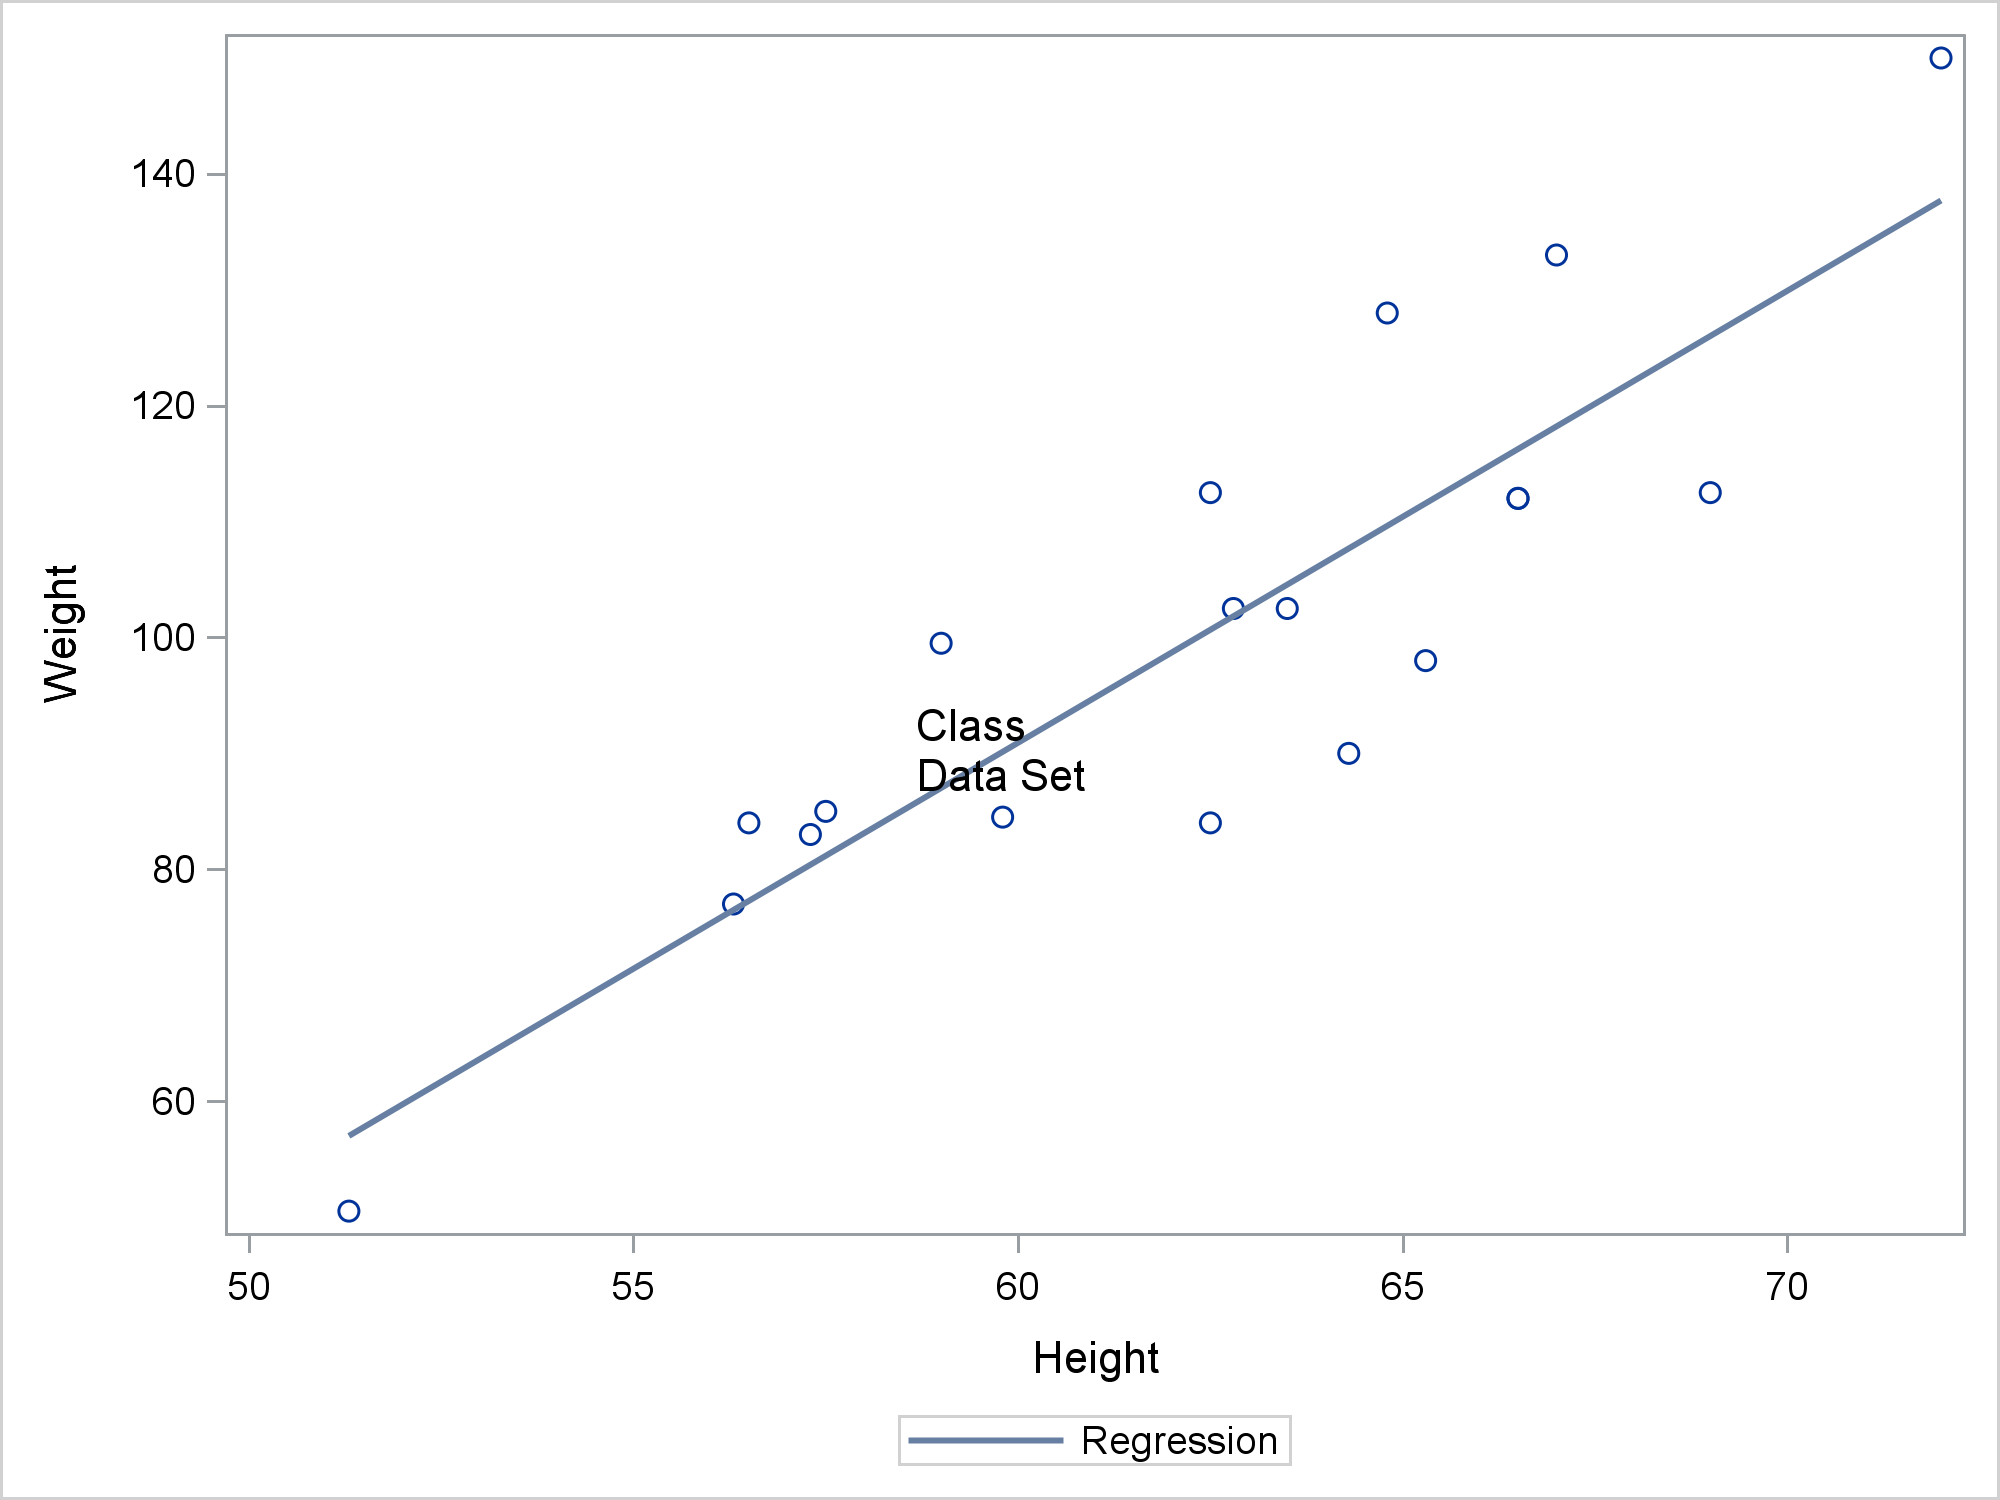
The Text function positions the value of the Label variable in the center of the graph space. In comparison, the following is an example of one of the simplest uses of a SAS procedure.
proc print data=sashelp.class; run; |
If you add something nonsensical or meaningless to a SAS procedure, you get one or more error messages.
71  +proc print data=sashelp.class nonsensical;
                                   -----------
                                   22
ERROR 22-322: Syntax error, expecting one of the following: ;, (, BLANKLINE,
              CONTENTS, DATA, DOUBLE, GRANDTOTAL_LABEL, GRANDTOT_LABEL,
              GRAND_LABEL, GTOTAL_LABEL, GTOT_LABEL, HEADING, LABEL, N, NOOBS,
              NOSUMLABEL, OBS, ROUND, ROWS, SPLIT, STYLE, SUMLABEL, UNIFORM,
WIDTH. |
If you add something nonsensical or meaningless to an annotation data set, it is usually silently ignored. This is by design. These steps produce the same graph that is displayed previously.
data anno; function = 'texts'; label = 'Class Data Set'; meaningless = 'nonsensical'; run; proc sgplot data=sashelp.class sganno=anno; reg y=weight x=height; run; |
This is an important key to understanding SG annotation data sets. SG annotation processes a data set looking for meaningful instructions, and it ignores everything else. The data set has a variable named Function. It can have (as of the last time I checked) 48 other variables that provide instructions. It can have any number of additional variables that are ignored. The Function variable has 10 values that specify different types of annotations. It can have any number of additional values that are ignored. See page 134 of Advanced ODS Graphics Examples for a list of the functions and variables. Many of these 480 Function/Variable combinations specify meaningful instructions. More than 270 are always ignored. (The actual number of ignored combinations is larger because in some cases, either one variable or another is required.) Change Function = 'Text' to Function = 'Texts' and that row is ignored. Even when you specify everything correctly, many of the values that can potentially appear in an SG annotation data set must be ignored for it to work properly.
You can create an SG annotation data set in as many ways as you can create any other SAS data set. You might create it from another SAS data set.
data anno(rename=(weight=y1 height=x1));
   set sashelp.class;
   retain Function 'Text' DrawSpace 'DataValue';
   Label = cats('(*ESC*){Unicode "', ifc(sex eq 'F', '2640', '2642'), '"x}');
   TextColor = ifc(sex eq 'F', 'red', 'blue');
run;

proc sgplot data=sashelp.class sganno=anno noautolegend;
   styleattrs datacontrastcolors=(blue pink);
   title 'Height and Weight By Sex';
   reg y=weight x=height / group=sex degree=3 markerattrs=(size=0);
run;
title; |
Then the variables x1, y1, Function, DrawSpace, Label, and TextColor provide annotations and any remaining variables from the original data set (Name, Sex and Age) are ignored.
You might read instream data. You might use RETAIN, programming, and assignment statements. You might use a combination of these techniques. The following three independent DATA steps illustrate.
data anno;
   retain Function 'Arrow' x1 x2 y1 y2 .
          x1Space x2Space y1Space y2Space 'GraphPercent  ' Direction 'Both'
          Width 40 FillColor 'White';
   length Label $ 40;
   input y1 x1Space label;
   x2Space = x1Space;
   label = catt(label, ' Space');
   x1 =  0; x2 = 100; y2 = y1; function = 'Arrow'; output;
   x1 = 50; x2 =   .; y2 = .;  function = 'Text '; output;
   datalines;
25 DataPercent   Data
40 WallPercent   Wall
70 LayoutPercent Layout
85 GraphPercent  Graph
; |
data anno;
   retain Function 'Text' x1 . y1 7 x1Space 'DataValue'
          y1Space 'GraphPercent' Width 21;
   do x1 = 20 to 60 by 10;
      Label = catx(' ', x1,"(*ESC*){Unicode '2264'x}", 'Age', '<', x1 + 10);
      output;
   end;
run; |
data anno;
   length yC1 $ 15;
   retain DrawSpace 'DataValue';
   Function='PolyLine'; yc1='Chrysler';         x1=2.5;     output;
   function='PolyCont';                         x1=3.5;     output;
                        yc1='Fiat';                         output;
                                                x1=3.0;     output;

   function='PolyLine'; yc1='Suzuki';           x1=3.5;     output;
   function='PolyCont';                         x1=6.0;     output;
                        yc1='Fiat + Chrysler';              output;
   function='Arrow';    yC2=yc1;                x2=5.0;     output;

   function='Text';     yc1='Honda';            x1=6.1;
   Anchor='Left';       Width=30;
   Label='Alliance creates the #6 global automaker by volume.';
                        x2 = .;                 yc2 = ' ';  output;
run; |
It is this last style of creating SG annotation data sets where it is probably easiest to make mistakes that lead to the question: what is wrong with my SG annotation data set? The first thing to do when you are not getting the expected annotations is examine all of the values of the character variables.
proc freq data=anno; tables _character_; run; |
Alternatively, you can list all of the values of all of the variables as follows.
proc freq data=anno; run; |
There is nothing wrong with any of the SG annotation data sets shown up to this point. When there is something wrong, you might easily see in the PROC FREQ output that one of the character variables is truncated. For example, if function='Arrow' preceded function='PolyLine', then the length of the Function variable would be 5 and 'PolyLine' would be truncated to 'PolyL'. You can either use a LENGTH statement to set the length or append enough blanks to the first value to ensure that the length is long enough for all values.
The following DATA step has a deliberate mistake.
data anno;
   length ID $ 3 Function $ 9 Label $ 40;
   retain x1Space y1Space x2Space y2Space 'DataPercent' Direction 'In';
   length xC1 xC2 $ 20;
   retain Scale 1e-12 Width 100 WidthUnit 'Data' CornerRadius 0.8
          TextSize 7 TextWeight 'Bold'
          LineThickness 1.2 DiscreteOffset -0.3 LineColor 'Green';

   ID       = 'LO1';            Function  = 'Text';
   Anchor   = 'Right';          TextColor = 'Green';
   x1       = 55;               y1        = 94;
   Label    = 'Coefficients for the Selected Model';                output;

   Function = 'Line';           x1        = .;
   x1Space  = 'DataValue';      x2Space   = x1Space;
   xc1      = '9+CrBB';         xc2       = '8+CrRuns*CrRuns';
   y1       = 94;               y2        = 94;                     output;

   Function = 'Rectangle';      y1Space   = 'WallPercent';
   Anchor   = 'BottomLeft';     y1        = 10;
   Height   = 80;               Width     = 0.6;                    output;

   ID       = 'LO3';            Width     = 100;
   Function = 'Text ';          Label     = 'Selected Value';
   x1Space  = 'DataPercent';    y1Space   = x1Space;
   Anchor   = 'Left';           TextColor = 'Blue';
   x1       = 86;               y1        = 84;                     output;

   Function = 'Arrow';          LineColor = 'Blue';
   x1Space  = 'DataValue';      x2Space   = x1Space;
   xc1      = '9+CrBB';         xc2       = '12+CrHits*CrHits';
   y1       = 4;                y2        = 83;
   DiscreteOffset = .1;         x1        = .;                      output;
run; |
Can you see the error by looking at the code? You can print the data by using PROC PRINT, but the listing is wide in a destination like HTML and it wraps in destinations like LISTING, PDF, and RTF, so it is hard to examine. It is much easier to use PROC FREQ.
proc freq data=anno; tables _character_; run; |
It is clear in the PROC FREQ output (only a portion of which is shown next) that the 'Botto' value of the Anchor variable is truncated.
Cumulative Cumulative Anchor Frequency Percent Frequency Percent ----------------------------------------------------------- Botto 1 20.00 1 20.00 Left 2 40.00 3 60.00 Right 2 40.00 5 100.00 |
The original DATA step had the specification Anchor $ 10 in the LENGTH statement to avoid this.
The correct version of the data set is part of the program that makes this graph. It adds text, a line, and a rectangle with rounded corners to the top graph and an arrow and a line to the bottom graph.
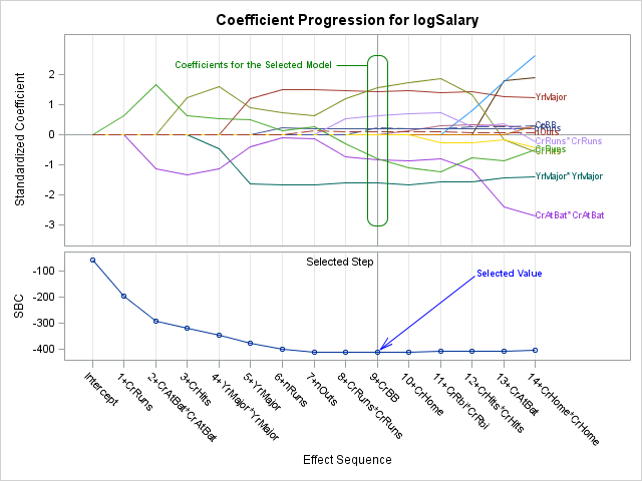
You can check the data set by using a macro that knows what the valid values are for the variables that have only a limited number of valid values.
The following step checks the SG annotation data set.
%annocheck(anno=anno) |
It displays the following.
Invalid: Anchor=Botto |
You can add errors to the SG annotation data set and check it again.
%annocheck(anno=anno(drop=xc1)) |
Now it detects both the truncated value and the missing variable.
At least one of each pair must be present: (x1,xc1), (x2,xc2), (y1,yc1), (y2,yc2) Present variables are: y1 y2 xC2 x1=. x2=. y1=94 y2=94 xC1= xC2=8+CrRuns*CrRuns yC1= yC2= Error: x1 and xC1 are both missing. At least one of each pair must be present: (x1,xc1), (x2,xc2) Present variables are: y1 x1=. y1=10 xC1= yC1= Error: x1 and xC1 are both missing. Invalid: Anchor=Botto At least one of each pair must be present: (x1,xc1), (x2,xc2), (y1,yc1), (y2,yc2) Present variables are: y1 y2 xC2 x1=. x2=. y1=4 y2=83 xC1= xC2=12+CrHits*CrHits yC1= yC2= Error: x1 and xC1 are both missing. |
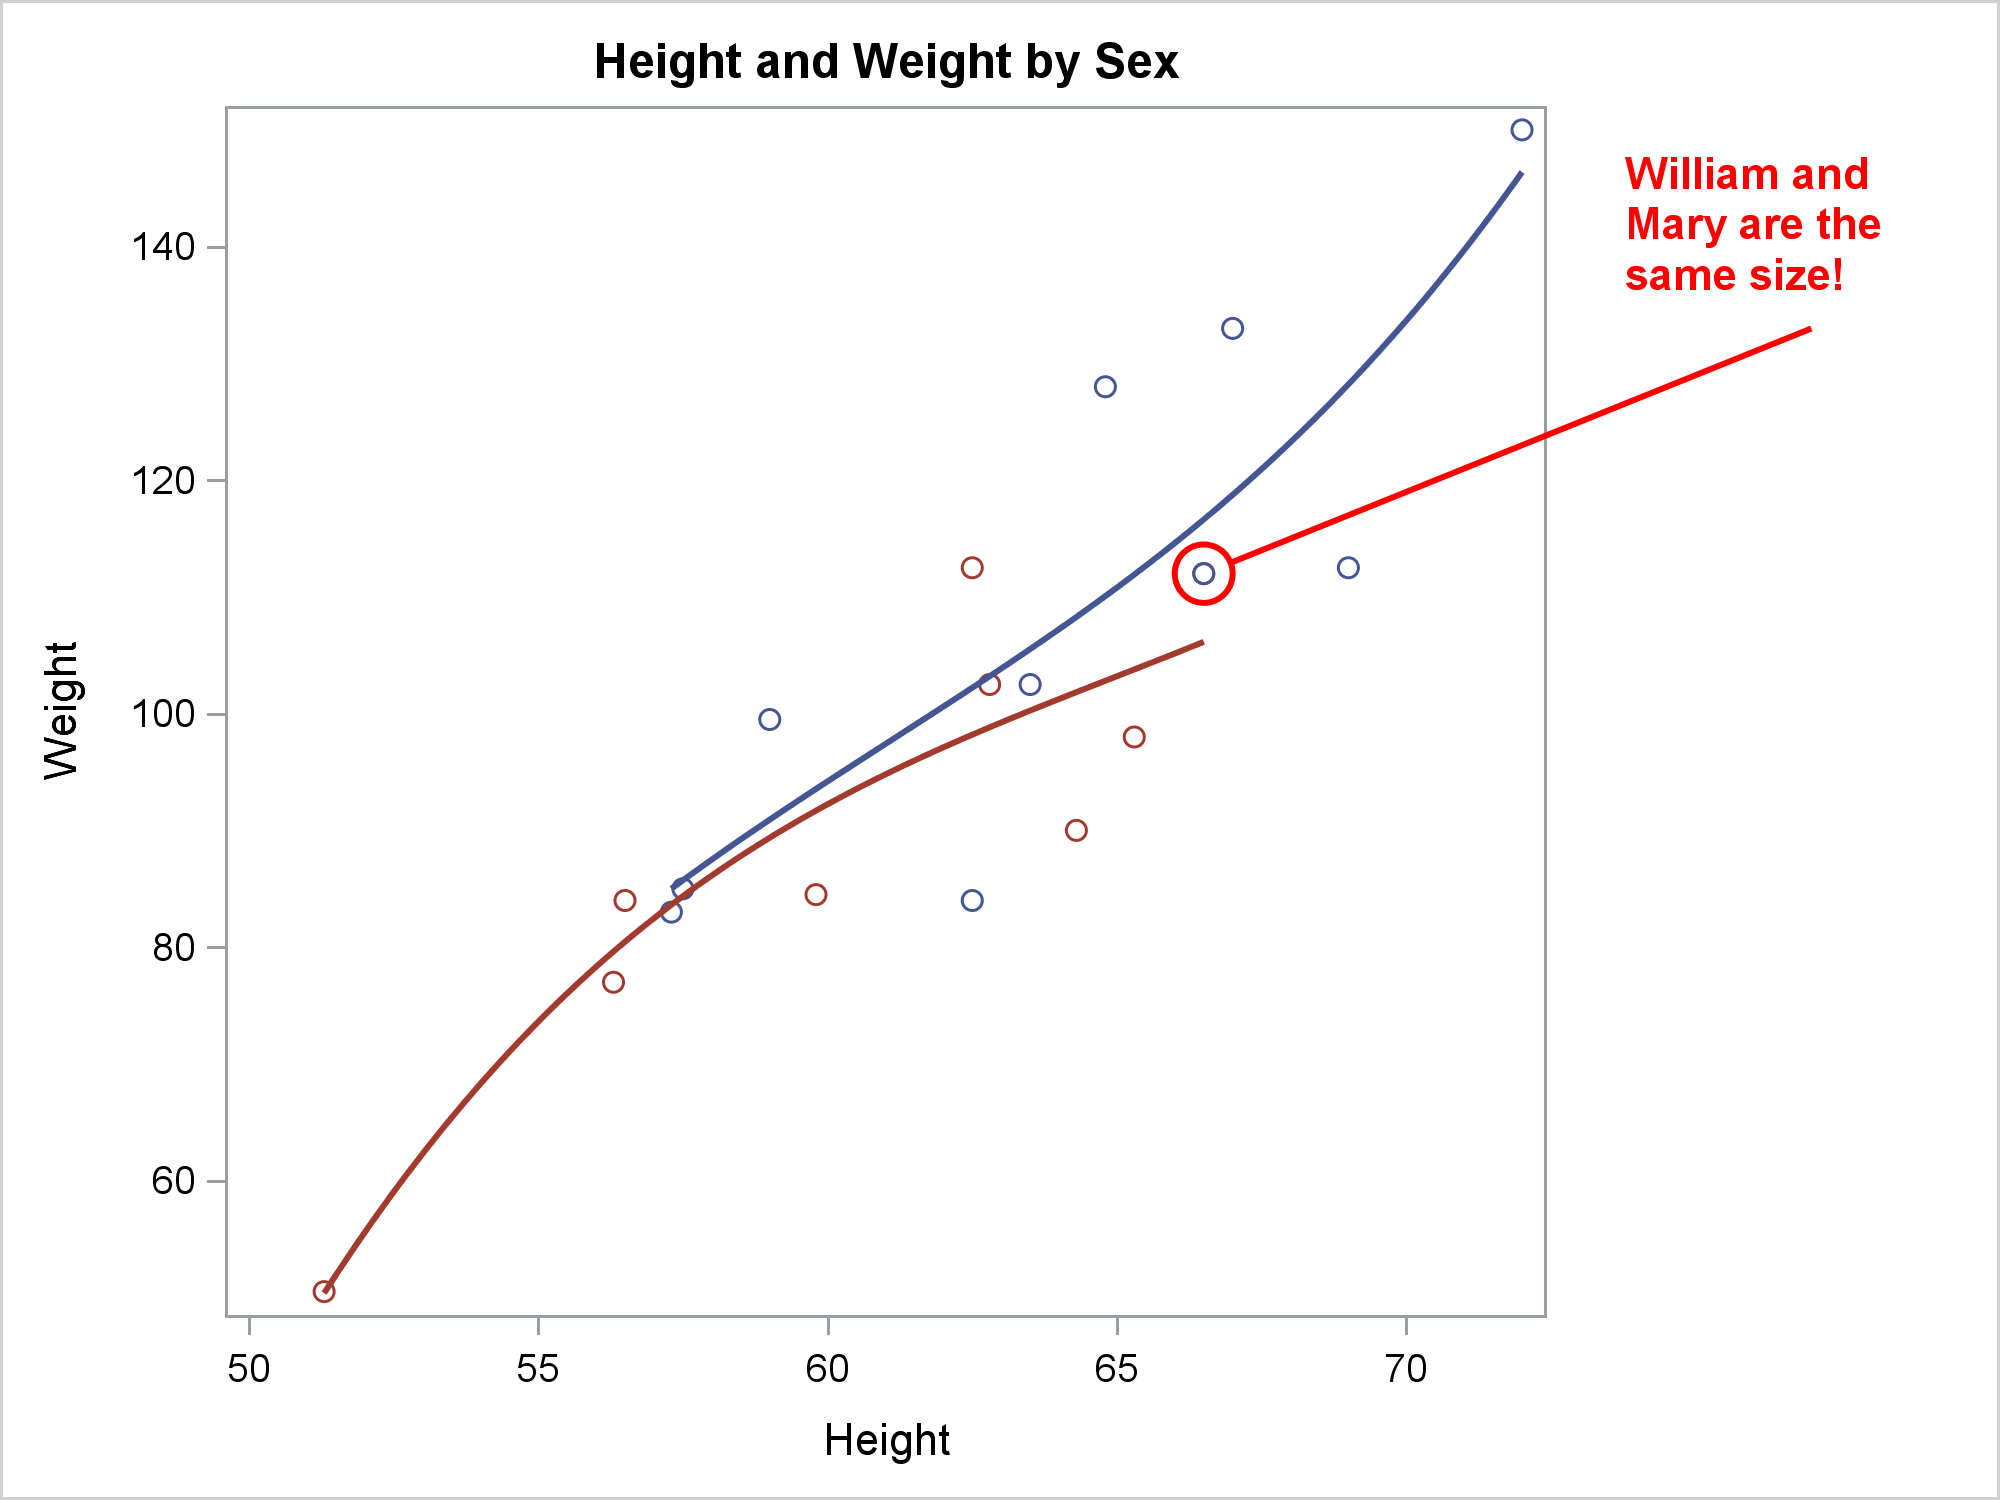
You can also use standard data set options such as OBS=, FIRSTOBS=, and WHERE= to use subsets of the SG annotation data set as you debug its contents. The following steps illustrate. Only the full results from the first PROC SGPLOT step are shown.
data anno(drop=name sex age);
   set sashelp.class(where=(name='William') rename=(height=x1 weight=y1));
   retain DrawSpace 'DataValue' Function 'Oval' HeightUnit WidthUnit 'Data'
              Height 5 Width 1 ID 'a' TextColor LineColor 'Red' TextWeight 'Bold';
   output;
   function = 'Line';
   x1 + 0.5;
   y1 + 1;
   x2 = x1 + 10;
   y2 = y1 + 20;
   output;
   x1 = x2 - 1;
   y1 = y2 + 9;
   function = 'Text';
   Label = 'William and Mary are the same size!';
   Anchor = 'Center';
   Width = 6;
   output;
run;

title 'Height and Weight by Sex';
proc sgplot data=sashelp.class sganno=anno
            pad=(right=30%) noautolegend;
   reg x=height y=weight / degree=3 group=sex;
run;

proc sgplot data=sashelp.class sganno=anno(obs=1)
            pad=(right=30%) noautolegend;
   reg x=height y=weight / degree=3 group=sex;
run;

proc sgplot data=sashelp.class sganno=anno(firstobs=2 obs=2)
            pad=(right=30%) noautolegend;
   reg x=height y=weight / degree=3 group=sex;
run;

proc sgplot data=sashelp.class sganno=anno(where=(function='Text'))
            pad=(right=30%) noautolegend;
   reg x=height y=weight / degree=3 group=sex;
run; |
For more information about SG annotation, see my free web book Advanced ODS Graphics Examples. In particular, see Chapter 4: Annotation, which begins on page 67.
