On a recent trip I met a long time user and early adopter of ODS Graphics who started using GTL with SAS 9.1.3, even before it was released as production with SAS 9.2. This user has presented many papers at SGF on GTL and some hands-on sessions on ODS Graphics Designer. During the conversation, the user expressed some concern that many programmers are not familiar with the options available to create high resolution graphics for papers and submissions using SGPLOT or GTL. So, I thought it would be useful to talk about output formats in this 6th installment of the Getting Started series.
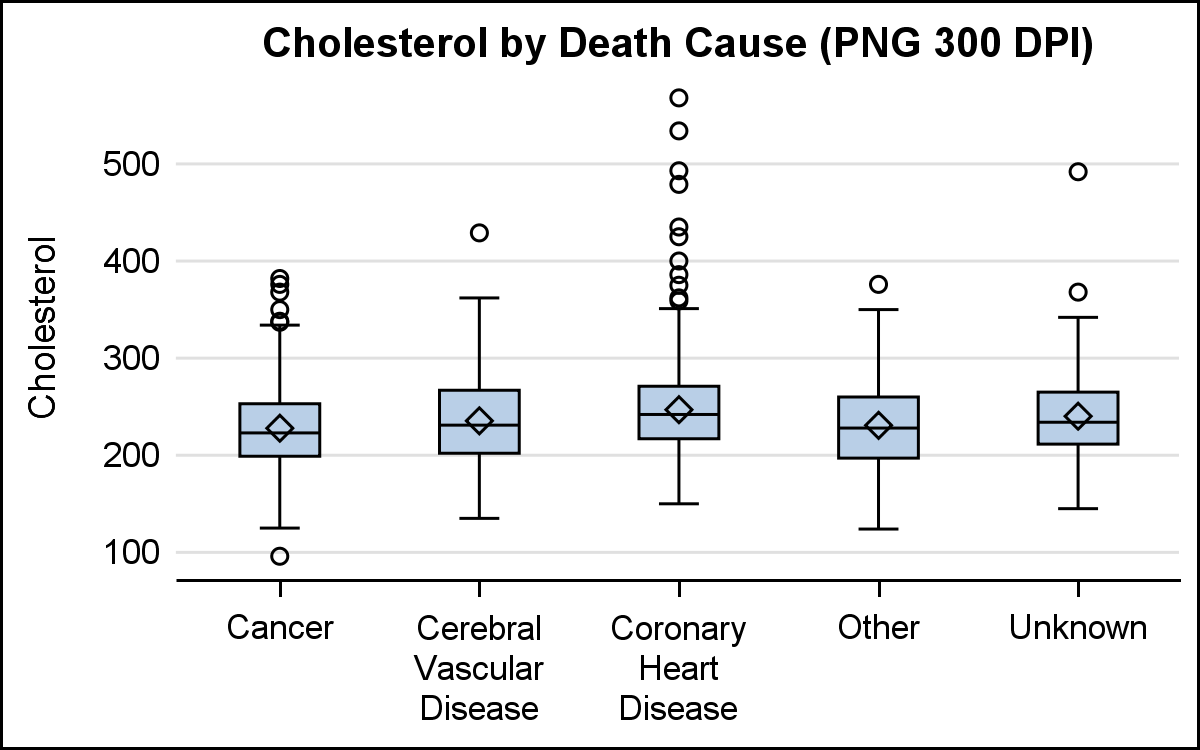
Previously, I have presented many articles how to build the graph you want using SGPLOT or GTL. Now, let us discuss how you get the high resolution output you need for submission of papers or to regulatory agencies. In this case, let us use an example of a simple box plot of Cholesterol by Death Cause shown below.

SGPLOT code for this graph is shown below.
ods listing image_dpi=200; title 'Cholesterol by Death Cause (PNG 200 DPI)'; proc sgplot data=sashelp.heart noborder; vbox cholesterol / category=deathcause; yaxis display=(noline noticks) grid; xaxis display=(nolabel); run; |
The default output format for ODS LISTING is PNG, and the default DPI is 96. The graph above is produced as default PNG output with default width (6.4") and height (4.8") settings but with an increased DPI=200. You can change the IMAGE_DPI (or DPI) on the ODS Destination statement and you can change the output format by using the OUTPUTFMT= option on the ODS GRAPHICS statement. Many setting are provided on the ODS GRAPHICS statement so you can change these on the fly without having to change the procedure or GTL template code. This is especially useful with the GTL Template as often these are canned templates that cannot (or should not) be changed.
Higher resolution graph output PNG files can be obtained by using the LISTING destination and setting a high DPI such as 300 or 600 using the IMAGE_DPI option. When individual graphs are desired so they can be inserted into other documents (manually), it is best to use the LISTING destination. Individual PNG files are created for each graph, and saved in the SAS "Current" folder. The GPATH option can be provided on the ODS Destination statement to put the files in a folder of your choice. Frequent readers of this blog will notice in the code attached with each article, that I normally set the GPATH and IMAGE_DPI at the top in most programs. For such usage, it is best to close any other open destinations to reduce unnecessary output.
ods _all_ close; %let gpath=C:\; %let w=5in; %let h=3in; %let dpi=200; ods listing gpath="&gpath" image_dpi=&dpi; ods graphics / reset width=&w height=&h; |
When writing a paper or submission, users new to the software will often insert the default graph produced as a PNG file at 640x480 pixels @ 96 dpi into the document. If the space for the graph in the document is about 6.6in wide, the image will fit well and you will see in the document what you see on the screen. However, when printed or displayed as a PDF document, this 96 dpi figure will not be optimal. It is better to render the graph at a higher resolution. I normally use 300 DPI for all my papers or books. You may go higher if needed, such as 600 dpi or even 1200 dpi. Note however, when you go to 1200 dpi, it is possible that the default system memory available for rendering may not e sufficient. You may see a warning message in the log.
WARNING: A very large output size of (6000, 3600) is in effect. This could make Java VM run out of memory and result in some Java exceptions. You should reduce the output size or DPI settings. |
In the above case, you can increase the JAVA memory for the system. Update your sasv9.cfg file and add the following to the -JREOPTIONS= ( ) section and restart SAS:
-Xms1024m
-Xmx1024m
However, often the space in the document is smaller than 6.6", as in the case of a 2-column paper format. When a 6.6" PNG file graph is inserted in a 3.5" space, bad things happen. The image is linearly scaled down to fit the space, and many text strings in the graph become hard to read. A 9pt font will look line a 4.5pt font, and become unreadable to many people. The way to address this is to create a graph with a width set to the amount of space in the final destination, with a high DPI. Setting the WIDTH=3.5in on the ODS GRAPHICS statement will make the resulting graph width of 3.5". However, all aspects of the graph will not be scaled linearly. Text items will scale down at a ratio of (Graph Height) / (Design Height) ** 0.25. With SGPLOT, Design height is always 4.8". Using a Graph Height of 2.4" will shrink the fonts by only to 85%, keeping them readable.
Below, I have shown the default 6.4"@200 dpi graph inserted at smaller size vs a 4" @300 dpi at same width. Note how the 4" graph has much better readable text for the axis labels and values.
Suggestion: Render your graphs as PNG files with the size of the destination space and high (300) dpi. JPG file format is not preferred for graphs as it uses "lossy" compression.
The markers and text for graphs will scale when the Graph height is different from Design height. However, you can disable the scaling by using NOSCALE option on the ODS GRAPHICS statement.
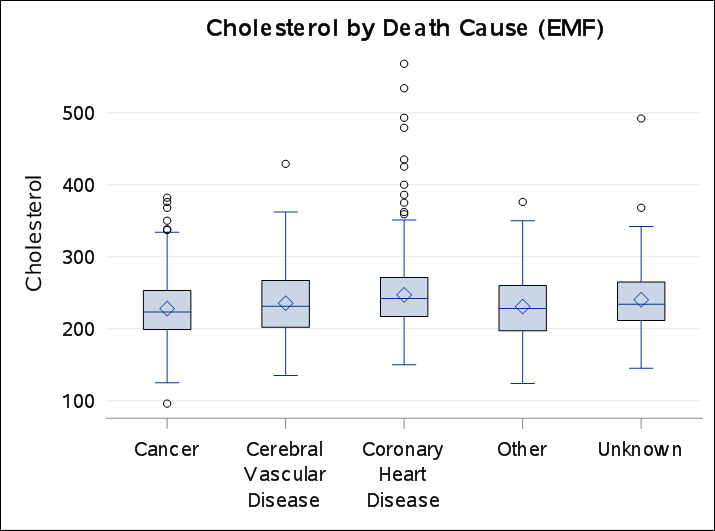
Many "Scalable" output formats are supported in ODS Graphics. These can be rendered directly into the related document, or output as individual files. You can use ODS PDF destination to get PDF graphs, RTF destination to get graphs in EMF format or HTML5 destination with OUTPUTFMT=SVG to get scalable graphs in the HTML5 format. You can render in PDF, EMF or SVG formats as individual files by using the LISTING destination with the appropriate OUTPUTFMT.
Scalable Vector Graphics output such as PDF, SVG will scale infinitely in the document or browser without pixellation. However, some features of graph may not be supported, such as gradient transparent color legends, or thick patterned lines. Also, there are some limitations for EMF output. Due to some Microsoft related issues, thick patterned lines cannot be rendered in EMF output. So, you will be better of using solid pattern colored lines for groups. Also, there are some issues on how the text is rendered, sometimes with uneven gaps in the characters of the text. I have included a screen capture of EMF output below. Note the rendering of the title text. EMF graphs are scalable, but when scaled up, the line thicknesses of various elements do not scale up as expected. You should be aware of these issues with EMF output.
Full SGPLOT code: Output

4 Comments
Dear Sir,
I have a box plot like the one above and I would like to add stars on it to show where a single observation from the sample falls within the distribution. Is there an easy way to do this?
Box Plot allows placing of Scatter plot layers on it. You could add a column of observations where you want the "stars", and then use a SCATTER statement to layer them on the boxes.
Does anyone have a workaround for the text-rendering problem? I have set the font to Arial using proc template so it shouldn't be a metrics problem, and I am plotting at full size (16cm x 25cm).
My EMF exports from R (devEMF) don't seem to suffer from this problem.
Pingback: Getting started with SGPLOT - Index - Graphically Speaking