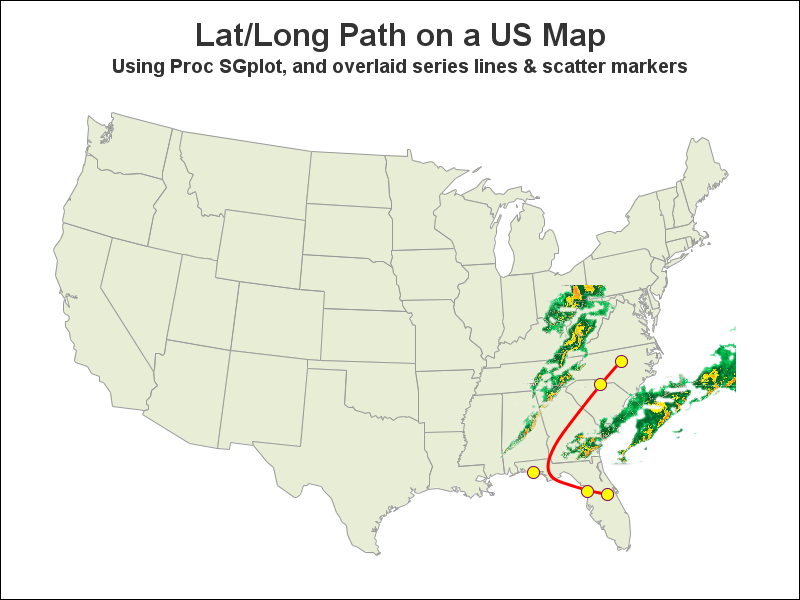
In his recent blog article on Drawing Paths on a Map using SGPLOT, Robert Allison showed us visually the path computed by the captain of his return flight from Orlando. As usual, one can rely on Robert to put in visual form some interesting bit of information. Thanks, Robert.
I thought it would be interesting if we could visualize the severe weather together with the path. So, I took the liberty of extending Robert's program by adding the Weather image Robert included. I made everything except the weather part transparent and overlaid the transparent weather image on the SGPLOT map.
I also used the SPLINE statement in place of SERIES as it works well in this case. See the result below.
Putting all the relevant information in one visual conveys more information. The part of code I added is shown below:
/*--Create transparent image annotation data set--*/
data annoImageTrans;
length function $10;
function='image'; x1=76; y1=40; height=40; width=35; transparency=0.0;
image='C:\Weather.png';
layer='front'; output;
run;
/*--Run the procedure with SG Annotation--*/
ods graphics on / reset imagename="Map_with_Image" height=6.25in width=8.33in;
title1 ls=0.2 height=22pt c=gray33 'Lat/Long Path on a US Map';
title2 height=12pt c=gray33 "Using Proc SGplot, and overlaid series lines & scatter markers";
proc sgplot data=my_map noborder noautolegend aspect=&aspect sganno=annoImageTrans;
<same as Robert's code>;
run;
In this case I had to manually adjust the location and size of the overlaid image to ensure the storm lines up with the state boundaries as in the original image. I think I am close, but not perfect. It may be close enough to show visually how the Captain threaded the eye of the (storm) needle to get Robert and the rest of the gang back home. It would be nice to come up with a way to register the image annotation directly with the underlying data. Suggestion are welcome.
Full SGPLOT code: Robert_Map_with_SGAnno

7 Comments
Nice enhancement, Sanjay!
This is really cool, and getting close to what I hope to do (annotate sparklines!) What about some modification of the %annomap %centroid macro that instead cross-references the position grid coordinates with the actual map coordinates? Because the position grid can change based on the output size, you'd have to make it flexible, but it seems like it would be doable. For annotating in SAS/GRAPH we essentially do something of the sort.
Neat graphic of how we got home from SGF Wednesday night. Thanks Sanjay!
Robert had the original idea. I only extended it a bit.
Very nice looking! Now, how can we dynamically feed that weather radar image into the SAS graph. In my earlier blog post Weather forecasting with SAS-generated Google maps I used Accuweather widget to feed real-time data (that includes the radar images) into Google maps Infowindow. Just wonder if something similar could be done here.
Just my thoughts here. I am hoping that (x, y) coordinates for the image corners can be provided in the same data space as the map polygons. These will likely be skewed after projection of the (lat, long) values into (x, y). Then I am hoping the image can be mapped from its rectangular shape into the skewed shape and placed in the right place in the map. It is likely the corners will be correct, but the interior may not be absolutely correct due to the nonlinear nature of the projection. Additional points (grid) in the interior of the image will help for better registering of the image.
Very cool! Here is the official route:
http://flightaware.com/live/flight/SWA430/history/20170405/2135Z/KMCO/KRDU