 Displaying nicely rendered axis values reduces clutter and makes the graph more readable. With SAS 9.4, we added the ability for splitting x-axis tick values on white space to create a nice and readable x-axis as shown in the graph on the right.
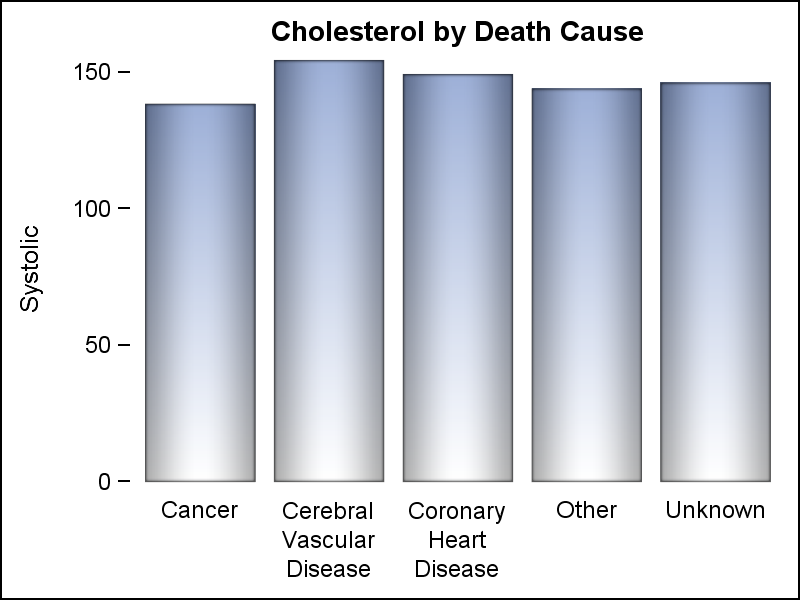
It is always a challenge to fit long tick values on the x-axis. With SAS 9.4, a new "FitPolicy" was added to GTL to split tick values on white space, and to fit these in the available space automatically. SGPLOT went a step further and made it the default fit policy (FitRotate). Now, knowing the space available on the x-axis for each tick value, first the procedure will try to split the long values on white space, and if the longest word still does not fit, we rotate the values.
 Prior to SAS 9.4, the default policy was to rotate tick values at 45 degrees if the entire value did not fit on one line on the x-axis. This caused the tick values to be displayed as shown on the right. While the graph on the right is not adversely affected, when values are long, this can take away a lot of space from the available height of the graph.
There are many cases of bar charts that have many category values on the x-axis, and users have asked for a way to display the x-axis values rotated vertically.
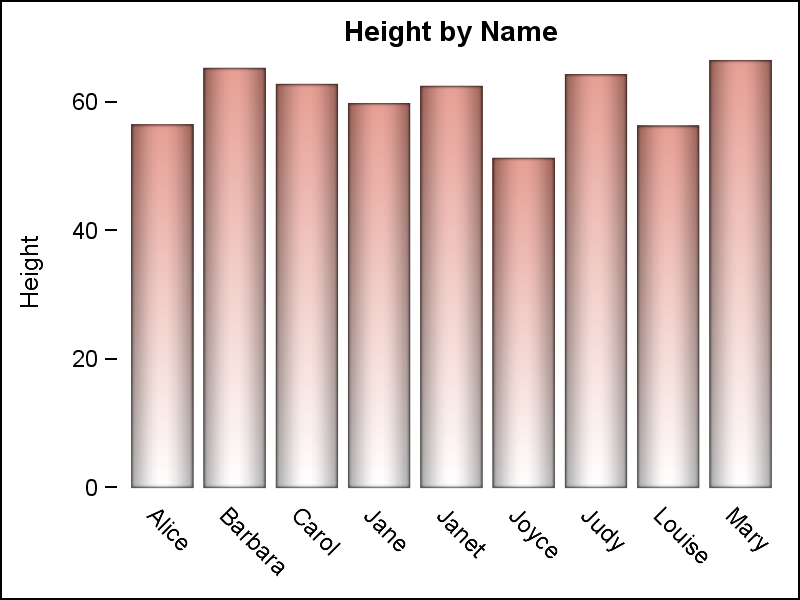
 With SAS 940M3, we added the ability to rotate the tick values vertically, as shown in the graph on the right. For SGPLOT, use VALUESROTATE=vertical. For GTL use TICKVALUEROTATION in the DiscreteAttrs bundle. Note the values are oriented bottom to top to match the axis label orientation on Y or Y2 axis.
title 'Height by Name';
proc sgplot data=sashelp.class
noautolegend noborder;
vbar name / response=height
dataskin=pressed nostatlabel
baselineattrs=(thickness=0)
fillattrs=graphdata3
filltype=gradient;
xaxis display=(nolabel noline noticks)
fitpolicy=rotate
valuesrotate=vertical;
yaxis display=(noline);
run;
 A few users have asked for an option to display the x-axis tick values such that the direction is vertical (top down), but each glyph is shown unrotated. This is sometimes also referred to as "Hotel" text, as shown on the right. This type of layout is not available at this time.
![]() This layout may also be useful with many Asian languages. If this is important for your applications, please chime in or call in the request to SAS Technical Support.
This layout may also be useful with many Asian languages. If this is important for your applications, please chime in or call in the request to SAS Technical Support.
SAS Code: tickvalueangle2

8 Comments
Could categorical tick values be labeled with a small image?
And, if yes, one could make an image of the label in the hotel/vertical layout.
Interesting idea. One could place images on the x-axis using annotate.
Such a solution would need some custom work.
Talking it over with some folks here, Lingxiao made an interesting suggestion.
Insert blanks after each character in the name, and use the SplitAlways option.
I tried it and it worked very well. Simple and scaleable.
I will post a followup.
This feature is very useful to us: we have very long and detailed axis labels. Up to now I have rotated all such graphs so the bars etc. are horizontal, just to get enough space for the labels. I can revisit this compromise now.
Does the splitting algorithm honour hyphens? Unicode has several hyphen characters which may be used with compliant web browsers to make table headings and therefore columns narrower. It would be nice if all ODS output, including graphics did this too.
You can set any character as the split character. Also, you can elect to keep or drop the split character from the displayed string.
See SPLITCHAR and SPLITCHARNODROP options.
Pingback: Hotel Text - Graphically Speaking
Great content Sanjay!
Thanks for this. Regarding Hotel text, I tried to get it by specifying in SGPLOT: splitchar='[long list of all letters]' splitcharnodrop fitpolicy=splitalways, but this doesn't work because as documented when there are consecutive split chars they are treated as one. Next try was to update the value of my x axis variable to have a pipe in between characters, and get hotel text via xaxis splitchar='|' fitpolicy=splitalways; Does that seem like a reasonable workaround? Full example code:
data class ; set sashelp.class (rename=(name=_name)); length name $40 ; do i=1 to length(_name) ; name=catx('|',name,substr(_name,i,1)) ; end ;run ;proc sgplot data=class ; scatter y=weight x=Name; xaxis splitchar='|' fitpolicy=splitalways; run ;
Worked for me when I ran your code.