CTSPedia is a valuable resource for clinical research "... initiated to form an information resource created by researchers for researchers in clinical and translational science to share valuable knowledge amongst local researchers".
This site includes a section on statistical graphs where you can find valuable information and a library of standardized graphs for the Clinical Trials industry. The library includes many graphs, some having "R" code and some "SAS". Many SAS graphs are now a bit dated, using SAS 9.2 features, and could be refreshed using the newer SAS 9.4 features.
One graph of interest is the Dot Plot of Primary SOC by Matt Soukup created using R. I thought it would be a good exercise to do the same graph using SAS 9.4.
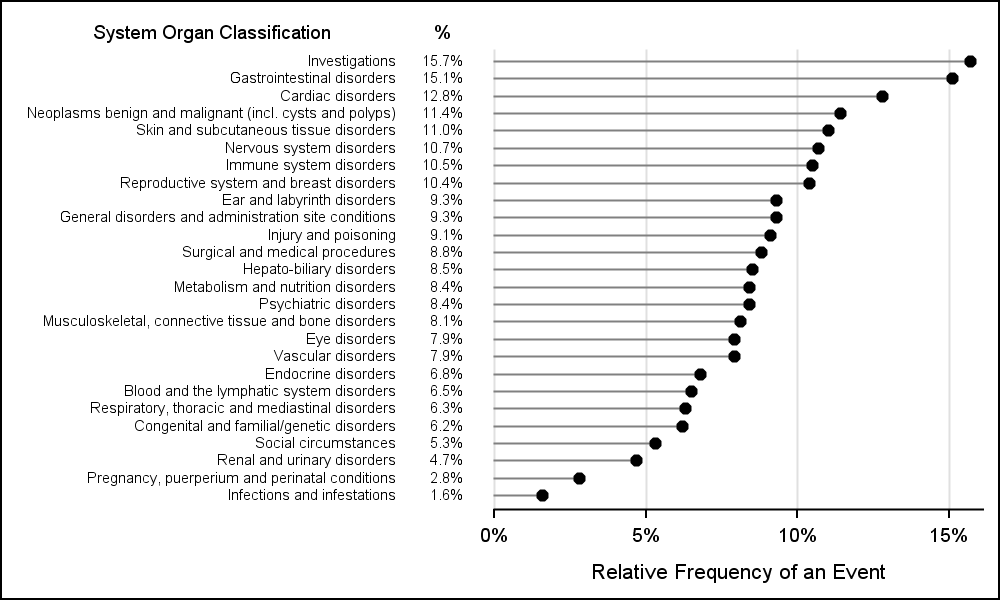 I was not able to run Matt's R program to get the data, but it was easy enough to enter the pct values by hand. The resulting graph is shown on the right and the SAS code is below. Click on the graph for a high resolution image.
proc sgplot data=dot_sort noborder;
dropline y=classification x=pct / dropto=y;
scatter y=classification x=pct /
markerattrs=(symbol=circlefilled);
yaxistable classification pct / location=outside
position=left pad=10 valuejustify=right ;
xaxis min=0 grid offsetmin=0 label='Relative Frequency of an Event';
yaxis fitpolicy=none valueattrs=(size=7) reverse display=none;
run;
My goal is to get as close to the graph in the CTSPedia library in appearance. A user can always further customize it. The graph above is almost identical to the graph shown in the CTSPedia link, and easy to create using the YAxisTable.
I am thinking it would be useful to write up a thread of such "CTSPedia" graphs which can be easily searched in the blog using the keyword "CTSPedia".
I will be at PharmaSUG 2016 next week in Denver. I look forward to seeing you there. I am presenting a 1/2 day seminar on Saturday on "Clinical Graphs using SAS", a paper and a SuperDemo on the same topic. Stop by and say "Hello" at the "Meet the presenters" booth if you have time.
Full SAS 9.4 SGPLOT code: Dot_Plot_SAS


3 Comments
Please tell me where can I get a copy of the dot_sort dataset.
I would like to try to reproduce this cool plot.
I realize the intent was to copy the original chart which is to all intents and purposes, a horizontal bar chart. As such, the stems must start at zero.
Removal of the stems would allow the use of a non-zero scale if the data warranted it, e.g. a range of 15 to 30 instead of 0 to 15. Dot plots outshine bar charts when there's no need to include zero and especially so when the range is tight and bar lengths would be almost imperceptibly different.
I agree. Also, using DOT plot without a zero baseline also allows the use of a LOG transform for the x-axis.