When ODS Graphics was first released with SAS 9.2 in 2008, a conscious effort was made to create graphs that were consistent and aesthetically pleasing out of the box. Features in the graph derive their visual attributes from the active Style. When Group classifications are in effect, the different classification levels of the group variable are represented on the screen using the attributes from the GraphData1 - GraphData12 elements of the Style.
 These attributes were carefully designed so the 12 colors are distinct from each other. The groups use up to 11 line patterns and 7 marker symbols. For each group value, the color, marker symbol and pattern are derived sequentially from these lists of 12 colors, 11 patterns and 7 symbols. So the first group level gets the first color, first pattern and the first symbol. The second group level gets the second color, second pattern and the second symbol. This goes on till we run out of the list of symbols (there are only 7). So, the eighth group level will get the eighth color, eighth pattern and the first symbol. This goes on in this manner so we can have 84 distinct colored symbols and 132 distinct colored patterns.
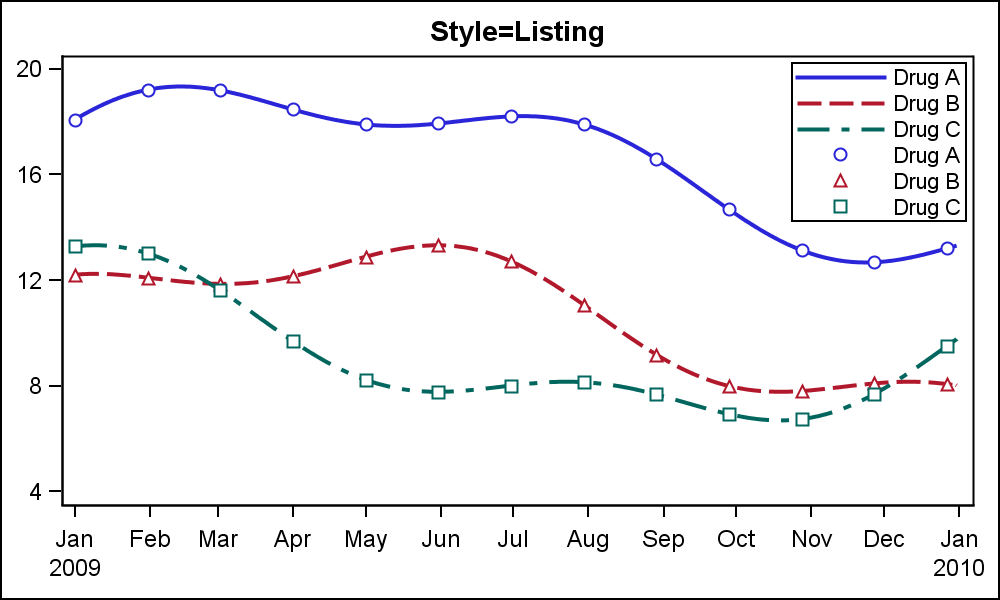
The graph above uses the LISTING style. The list of marker symbols has been changed to include filled markers. Here you can see the assignment of colors, line patterns and marker symbols for each of the three group values. Click on the graph to see a higher resolution image.
ods listing style=listing; title 'Style=Listing'; proc sgplot data=seriesGroup; styleattrs datasymbols=(circlefilled trianglefilled squarefilled); series x=date y=val / group=drug lineattrs=(thickness=2); scatter x=date y=val2 / group=drug filledoutlinedmarkers markerfillattrs=(color=white); keylegend / title='' location=inside position=topright across=1; xaxis display=(nolabel); yaxis display=(nolabel) integer values=(4 to 20 by 4); run; |
Note the use of FilledOutlinedMarkers in the Scatter plot. Also, I have used the SAS 9.4 STYLEATTRS feature to change the group symbols to the list of three filled symbols.
 Soon it was perceived that it is not always necessary to change all the attributes of the element for each group value. This was especially true for the line patterns. When using a color Style, it was felt that it was not necessary to change both line color and pattern, but only the color till all colors from the list are used.
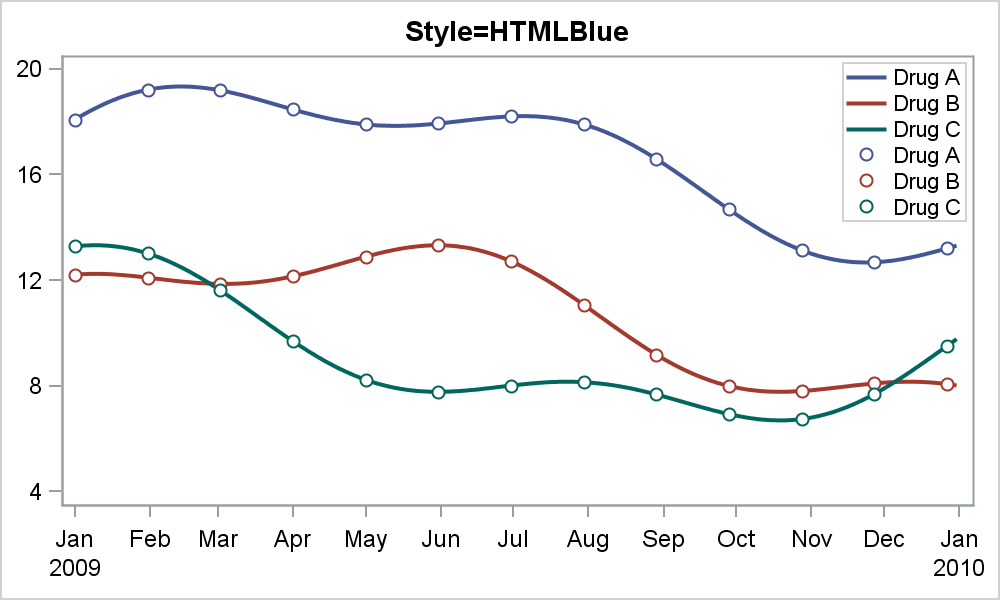
The graph above is created using the SAS 9.3 HTMLBlue style. In this style, the cycling of the attributes (color, symbol and line pattern) is different from the LISTING style. As you can see, all the three groups have solid line patterns and circle marker. Only the line color is changed per group. So, the first 12 group values get the 12 different colors from the Style, along with the first line pattern and first symbol. The 13th group level will get the 1st color with the 2nd line pattern and 2nd symbol. Most of the time we only have a handful of group levels, so only color change is seen.
I recall seeing a presentation where the presenter was baffled on why he was not seeing different marker symbols for his scatter plot when he ran his SAS code, but was seeing only circle markers with different colors. This was because, while at home he was using SAS 9.2, the presentation laptop had SAS 9.3 with the default destination of HTML with the HTMLBlue style. He had to change the style back to LISTING to see the different shaped markers.
This behavior of the different Styles is called Attribute Priority. The default AttrPriority is NONE, meaning that all the attributes are cycled together as for the LISTING style. HTMLBlue has AttrPriority=Color. This means that only the color attribute is cycled first holding the symbol and pattern constant till all the 12 colors are use up. Then, we go to the second symbol and second pattern and cycle through all 12 colors again.
While this behavior was first introduced in SAS 9.3, this AttrPriority behavior was internally implemented. With SAS 9.3M1, the AttrPriority option was surfaced in the Style. With SAS 9.4, AttrPriority option was surfaced in the ODS Graphics statement.
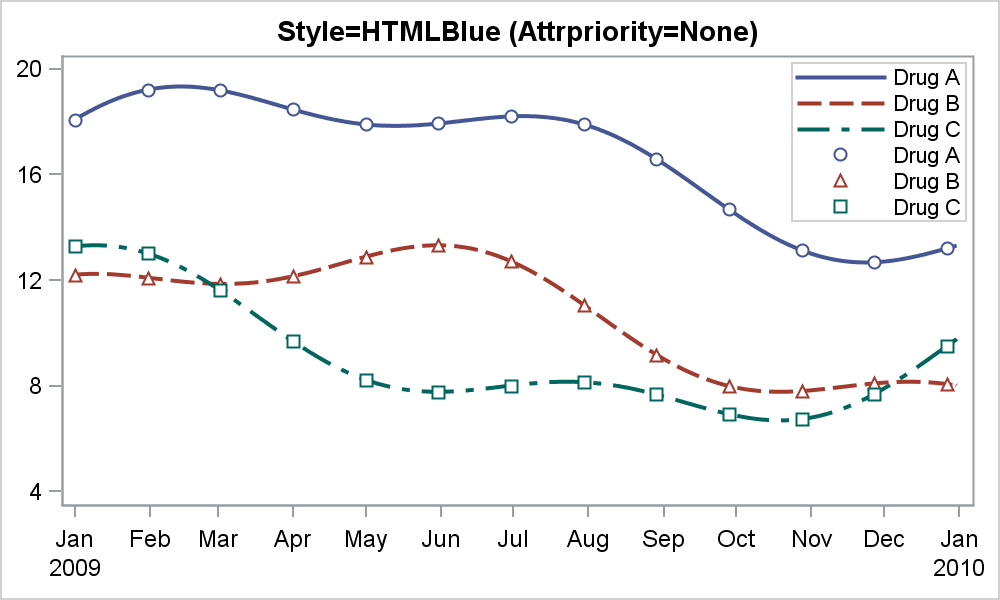 Now, with SAS 9.4, you can make any Style behave in any attribute priority you want by setting the AttrPriority= option in the ODS Graphics statement. Here is the HTMLBlue style with the AttrPriority set to NONE. Now, all the visual elements come from the HTMLBlue Style (except the overridden symbols), but now all the attributes are cycled together. So, the 2nd group value now gets a dashed line pattern and the TriangleFilled symbol.
ods listing style=htmlblue; ods graphics / attrpriority=none; title 'Style=HTMLBlue (Attrpriority=None)'; proc sgplot data=seriesGroup; styleattrs datasymbols=(circlefilled trianglefilled squarefilled); series x=date y=val / group=drug lineattrs=(thickness=2); scatter x=date y=val2 / group=drug filledoutlinedmarkers markerfillattrs=(color=white); keylegend / title='' location=inside position=topright across=1; xaxis display=(nolabel); yaxis display=(nolabel) integer values=(4 to 20 by 4); run; |
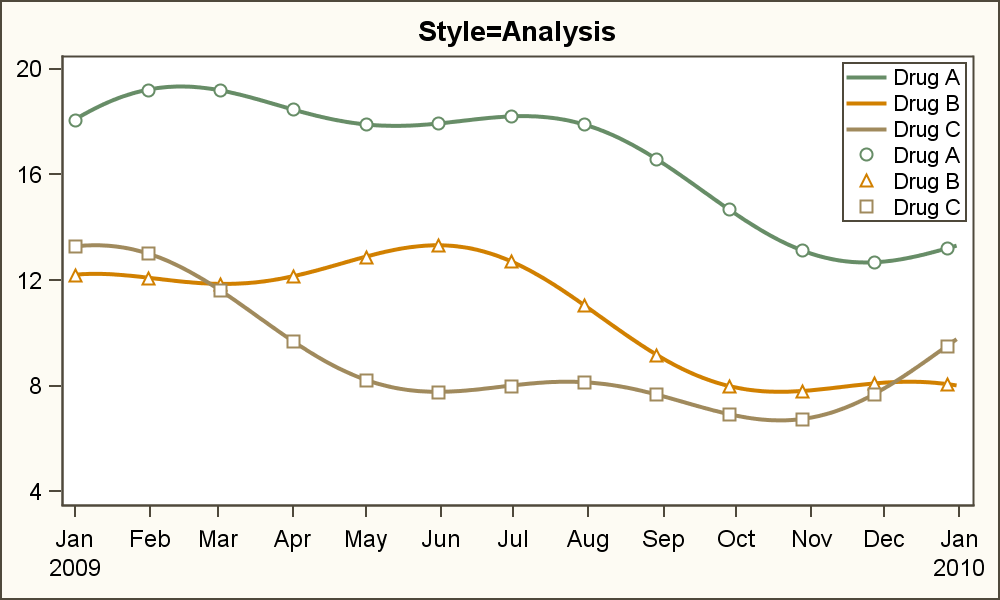
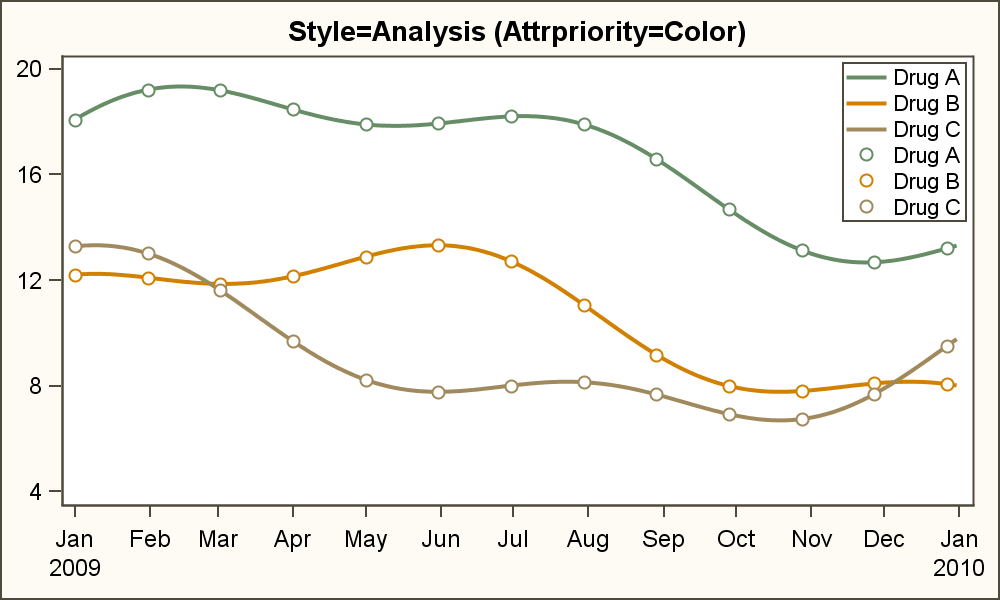 Here is an example of the same graph with the ANALYSIS style with AttrPriority=COLOR. Note, in this case, both line pattern and marker color are held constant while color changes.
Often, one really does want the colors and symbols to change with group level, but not the line pattern. This could be another value for the AttrPriority option (future). But currently, we have only provided for AttrPriority of NONE and COLOR.
 To create graph where the colors and symbols for groups change but not the line pattern, you will have to use a AttrPriority=NONE and hold the pattern by setting it to SOLID in the series plot. Sure, this is not as good as having a value for AttrPriority that could do that for you, but that will have to wait till there is a strong demand for it. Note, in the graph on the right, the color and symbols are changing, but the line pattern is held constant by setting lineattrs=(pattern=SOLID) in the code.
Full SAS 9.4 Code: AttrPriority


4 Comments
Interesting post Sanjay. Thank you for sharing. 🙂 The method seems quite similar to the options in the %modstyle macro but easier to implement.
Pingback: Getting Started with SGPLOT - Part 1 - Scatter Plot - Graphically Speaking
Pingback: Highlight forecast regions in graphs - The DO Loop
Pingback: Getting Started with SGPLOT - Part 4 - Series Plot - Graphically Speaking