![]() SGF 2015 was a blast with a focus on Visual Analytics, SAS Studio, Hadoop and more. Graphs were everywhere, and it was a banner year for ODS Graphics with over 15 papers and presentations by users on creating graphs using SG Procedures, GTL and Designer.
SGF 2015 was a blast with a focus on Visual Analytics, SAS Studio, Hadoop and more. Graphs were everywhere, and it was a banner year for ODS Graphics with over 15 papers and presentations by users on creating graphs using SG Procedures, GTL and Designer.
Dan Heath, Prashant Hebbar, Scott Singer and I were alternatively manning the ODS Graphics station and the Super Demo station. We had a steady stream of users sharing their experiences with these graph tools. The general feed back was awesome, and we were impressed with the level at which you folks have adopted these tools and using them to create graphs. I was pleasantly surprised some of you already using the SAS 9.40M2 features, including the TextPlot (looking at you, Jim!).
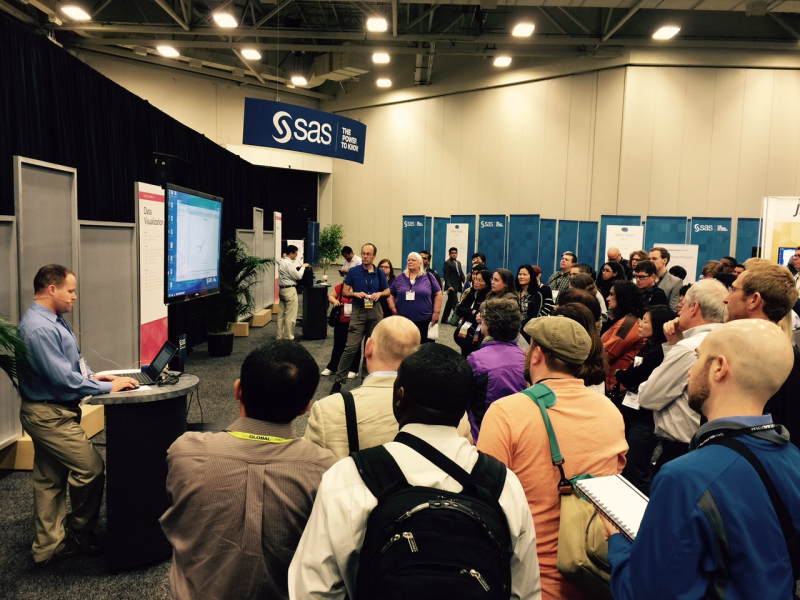
 Dan presented the new features in SG Procedures 4-5 times. Here he is expounding upon the sorting features in the SGPanel procedure.
Normally, Super Demos are scheduled for 20-30 minutes, but Dan was holding forth well into the full hour. This may have caused Scott Singer a bit of stress as he was often following Dan with a Super Demo on the ODS Graphics Editor and Designer.
 Scott's Super Demos on Designer and Editor were also well attended with many in the audience wondering why they were only now hearing about these tools. Designer has been included with SAS since 9.2M3, and been available off the Tools menu since SAS 9.3.
Designer is an interactive graph creation tool using which you can create many common graphs with a point-n-click GUI interface. Scott also demonstrated the "Auto Chart" feature in Designer allowing you to create literally hundreds of graphs from your selected data and variables in minutes. Designer generates the required GTL for the graph that can be viewed as the graph is being created, and the code can be copied and pasted into the Program window for further customization. If you have not seen it yet, click on Tools->ODS Graphics Designer to launch the application.
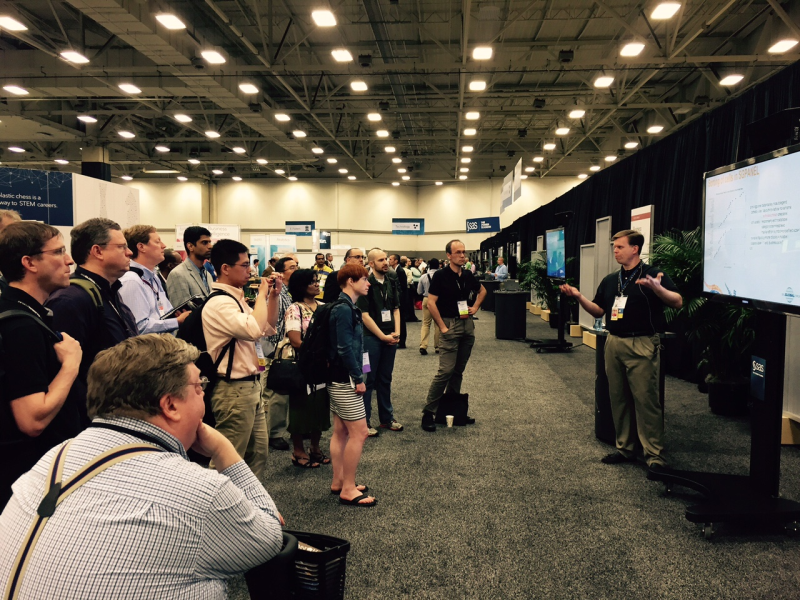
 It is always a pleasure to meet with you folks and discuss the ways in which you are using the graphics tools, your pains and innovative solutions. Kirk presented a paper on building an interactive dash board using ODS Graphics. He showed ways to include bar charts and pie charts in the display with URL links in each. There seems a lot of potential to create innovative dashboards using these tools included in Base SAS. Previously, I had taken a stab at creating some Dashboard widgets using SGPlot. The picture on the left with Kirk is at the Kennedy Memorial on the way back from the awesome R J Mexican restaurant in West End.
An exciting new development is the ability to include "native" Excel charts in the Excel destination using the new MSCHART procedure. This procedure will be released preproduction with SAS 9.4M3 in summer. Scott Huntley and Nancy Goodling presented multiple Super Demos on this topic and got an enthusiastic reception from many of you who frequently send output to Excel spreadsheets.
We were gratified to attend papers on graphics by Philip Holland, Jeffrey Meyers, Susan Slaughter and Lora Delwiche, Rebecca Ottesen, Chuck Kincaid, Kirk Lafler, LeRoy Bessler and many more. Prashant and I presented papers describing new features in SAS 9.4.
Here are sone of graph papers that come to mind.
1601 - Nesting Multiple Box Plots and BLOCKPLOTs Using Graph Template Language and Lattice Overlay - Greg Stanek.
2242 - Creative Uses of Vector Plots Using SAS® - Deli Wang.
2441 - Graphing Made Easy with SGPLOT and SGPANEL Procedures - Susan Slaughter and Lora Delwiche.
2480 - Kaplan-Meier Survival Plotting Macro %NEWSURV - Jeffrey Meyers.
2686 - Converting Annotate to ODS Graphics. Is It Possible? - Philip Holland.
2986 - Introduction to Output Delivery System (ODS) - Chuck Kincaid.
2988 - Building a Template from the Ground Up with Graph Template Language - Jed Teres.
3080 - Picture-Perfect Graphing with Graph Template Language - Julie VanBuskirk.
3193 - Mapping out SG Procedures and Using PROC SGPLOT for Mapping - Frank Poppe.
3419 - Forest Plotting Analysis Macro %FORESTPLOT - Jeffrey Meyers.
3432 - Getting Your Hands on Reproducible Graphs - Rebecca Ottesen.
3487 - Dynamic Dashboards Using SAS® - Kirk Lafler.
3518 - Twelve Ways to Better Graphs - LeRoy Bessler.
SAS1748 - Lost in the Forest Plot? Follow the Graph Template Language AXISTABLE Road! - Prashant Hebbar.
SAS1780 - Graphs Are Easy with SAS® 9.4 - Sanjay Matange
PharmaSUG 2015 is just around the corner in Orlando next week. I look forward to more presentations on innovative usage of graphics. I will present a 1/2 day seminar on "Clinical Graphs using SG Procedures" on Wednesday. Hope to see you there.


