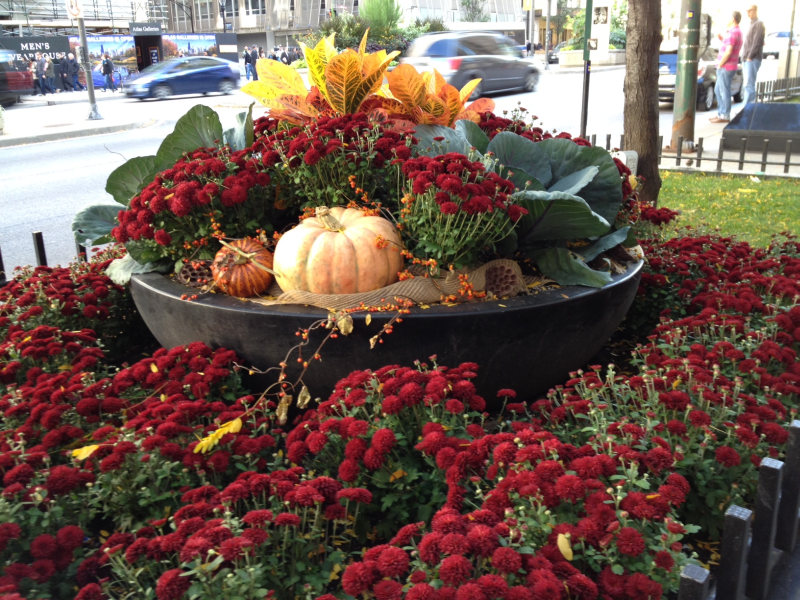
 The Mid-West SAS Users' Group conference in Chicago was a great success, with over 400 attendees and great weather. The conference hotel was in downtown with nice view of the river and a stroll down "Magnificent Mile". The city does a great job with the flower beds down Michigan Ave., along the sides and in the median. I suppose this time, the theme was Thanksgiving.
From graphics perspective, the conference was loaded with excellent presentations, two of which won the "Best Paper" in their tracks.
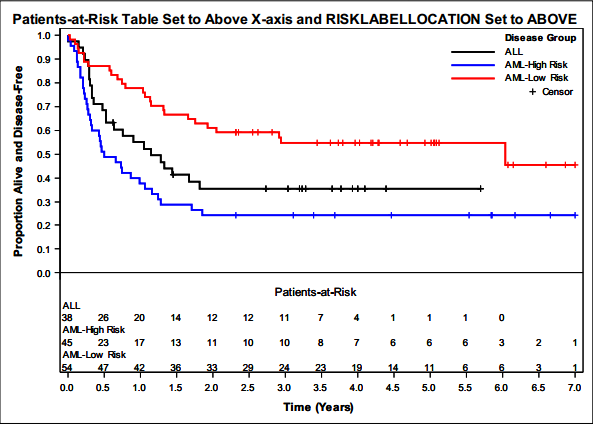
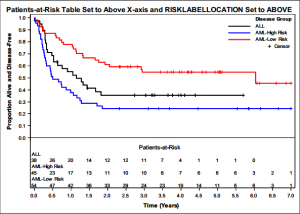 Kaplan-Meier Survival Plotting Macro %NEWSURV - Jeffrey Meyers, Mayo Clinic, Rochester, Minnesota. - In this paper Jeffrey presented the techniques he used to create the Survival Plot using GTL.
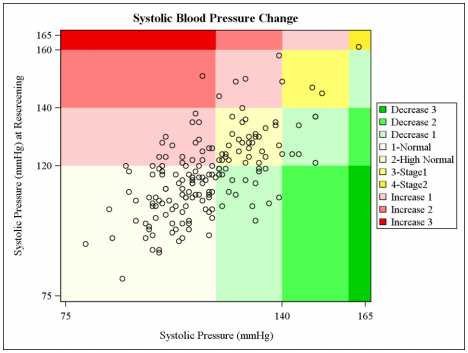
- Categorical AND Continuous – The Best of Both Worlds - Kathryn Schurr, Ruth Kurtycz, Spectrum Health-Healthier Communities, Grand Rapids, MI. In this paper, the authors examined the ways in which data can be visualized using discrete and interval displays by banding the interval data space into logical zones.
 Many other papers were presented using SG Procedures, GTL and SAS/GRAPH techniques including:
- DV-04. Labelling without the Hassle: How to Produce Labeled Stacked Bar Charts Using SGPLOT and GTL Without Annotate - Joe Matise, NORC at the University of Chicago, Chicago, IL .
- DV-03. SAS® Graphs with Multiple Y Axes — Some Useful Tips and Tricks - Soma Ghosh, UnitedHealth Group, Minneapolis, MN.
- DV-08. Visualization of Self-Reported Alcohol Use Data: A Timeline Followback Dashboard using Heatmaps, Time Series Plots, and HTML Hover-Text - Daniel Fuhrmann, University of Wisconsin-Milwaukee, Milwaukee, WI.
- DV-10. Pin the SAS® Tail on the Excel Donkey: Automatically Sizing & Positioning SAS Graphics for Excel - Ted Conway, Chicago, IL.
- HW-07. ODS Graphics - Chuck Kincaid, Experis Business Analytics, Kalamazoo, MI.
- RF-11. A Simplified Approach to Add Shading to your Graph using GTL - Jennifer L Yen, Abbott Laboratories, Abbott Park, IL.
Here is a link to the Conference Proceedings.
