For far too long we have been using the venerable Scatter Plot to do the work of placing text strings in the graph. For far too long we have used the Scatter Plot or the Block Plot to place axis aligned text in the graphs. It is time to move on.
When we started down the ODS Graphics path over 10 years ago, little did we know how often we would need to do the above. Almost every clinical graph needs text placed judiciously in the graph. With SAS 9.4, we released the Axis Table to simplify the task of placing axis aligned text. Now with SAS 9.4M2, we release the TEXTPLOT for general purpose text placement in a graph.
The Text Plot renders text in the graph in various different ways. Freed from the Scatter plot, we can specialize this plot to render text in ways that did not make sense with the scatter plot. Here is the basic syntax:
textplot x=var y=var text=var / group=var colorresponse=var sizeresponse=var; |
 This new statement makes it possible to create graphs with text alone, or add text in different ways to your graph. Here are some examples.
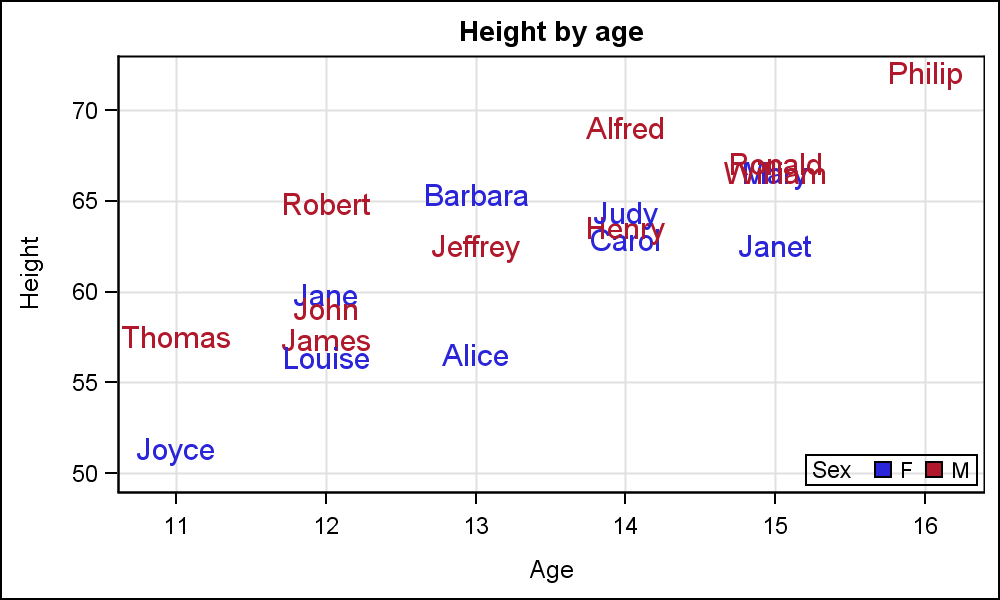
Simple text plot: In this case, we use the basic options on the text plot to display the name of each person in the class data set positioned by Height and Age classified by the variable 'Sex'.
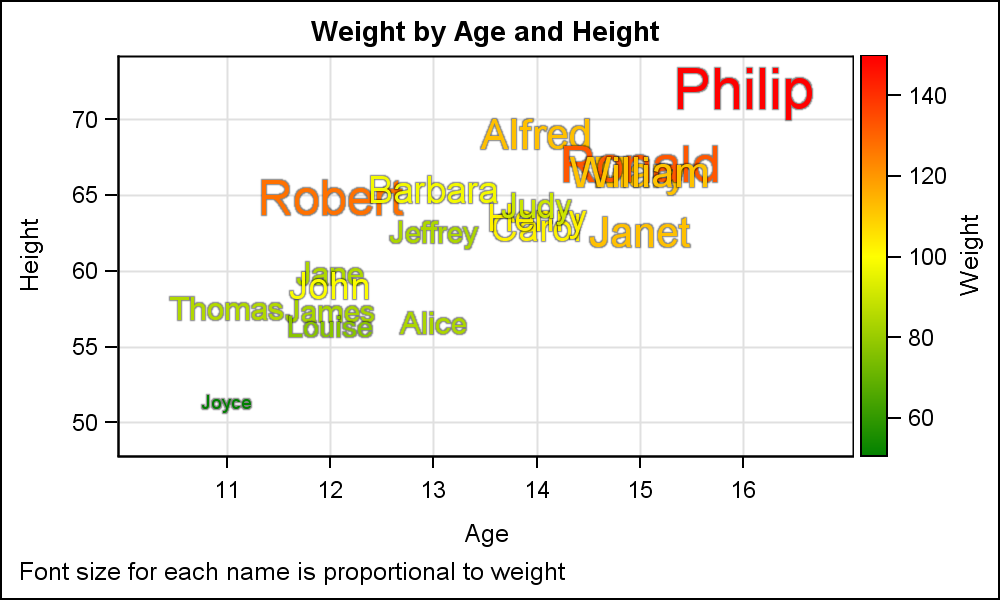 Text Plot with Size and Color Response: In this example, the font size of the name of each person is proportional to the values in the variable used for the Size Response role. The color of the text string is determined by the Color Response role. In this case, both size and color are determined by the same variable "Weight". Click on the graph for a higher resolution image. You will also notice in the larger version that the text has a soft "backlight". This helps in discerning text that has a color close to the background color, like the yellow text.
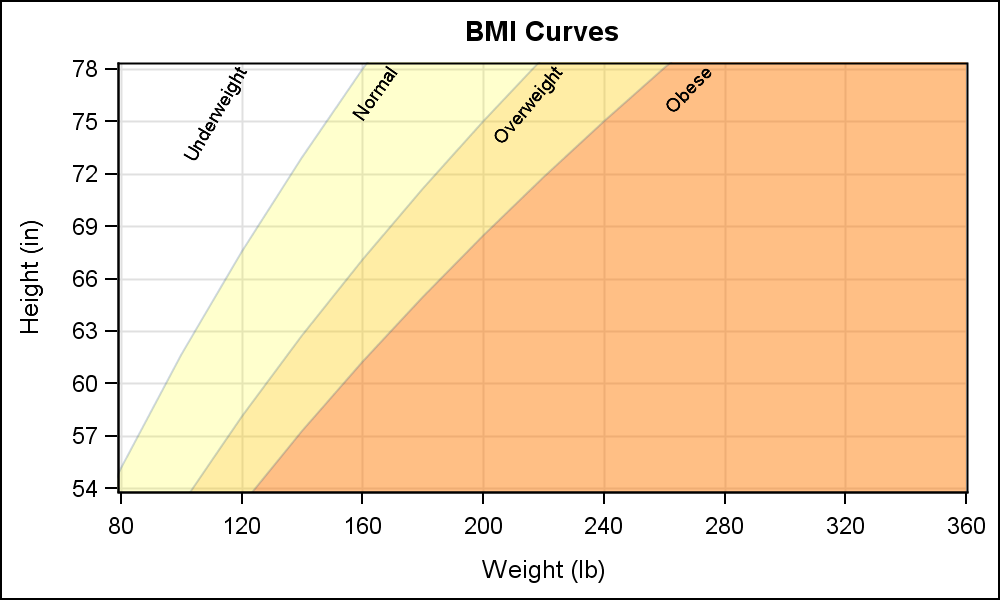 But the Text Plot goes beyond such features to support rotated text, aligned to the 9 compass directions as shown in the graph on the right. In this case, we have displayed the standard BMI curves as bands, and want to label them along the top. Using horizontal text can be a problem for narrow bands. So, in this case I have specified an angle of rotation independently for each string in the column.
To render rotated text, you can specify an angle of rotation in degrees for each string separately. This works quite well in most cases, but in this case it can be a problem as the slope of the curve can change based on the aspect ratio of the graph. So, specifying the angle in data coordinates instead of screen coordinates may work better. We will be sure to add an option to do that soon.
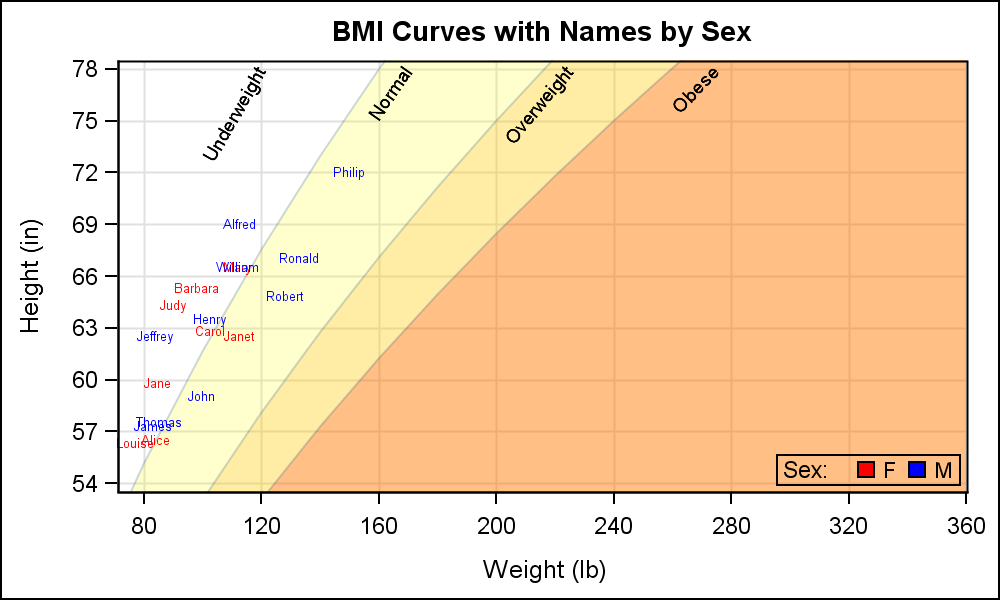 Clearly, you can overlay markers on the BMI curves to display the values for each subject in a study. One could use the scatter plot to display the value for each subject, but here we have use the Text Plot itself.
Finally, certain things are harder to do, where you need to know the exact dimensions of the text being rendered. For example, I was attempting to see how far I can get creating a "Word Cloud" graph using the Text plot. I can size and color each string by a response value based on some statistic (say number of occurrences), and place a string where I want. But, only the Java rendering code knows the exact string box sizes, which vary for each string. I cannot know where a string ends for proportional fonts to exactly position the next string.
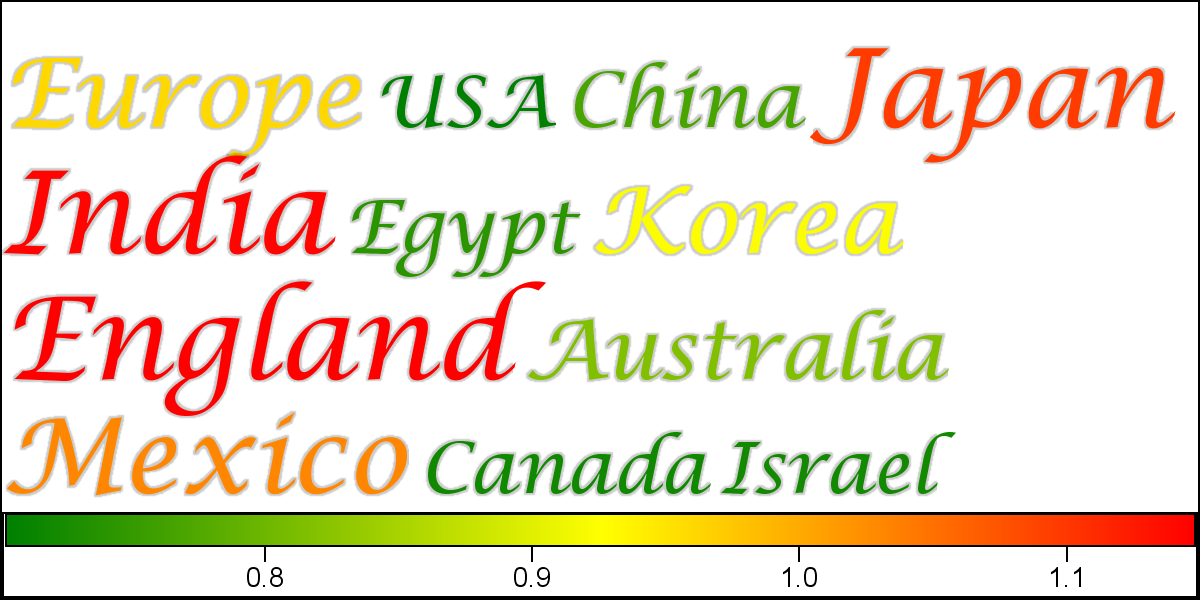 As an exploration of what could be possible, we created a feedback mechanism to allow the user to know the exact size of a text string (for any given font, weight, size or style). The renderer can write this information to a file on disk, which can be read back by the user. Now, using a two pass process, you can create a perfect word cloud yourself as shown on the right.
In the example on the right, I first rendered all the text strings with the correct size, font and style, but all at (x, y) = (0, 0). We added a mechanism (still under development) to write the actual bounding box of each string in pixel and data space into a csv file. I read back this information using proc import, and merged the text box information with the original data. Now, I ran a data step to position each string in sequence, wrapping to the next line when I have reached the end of the data space.
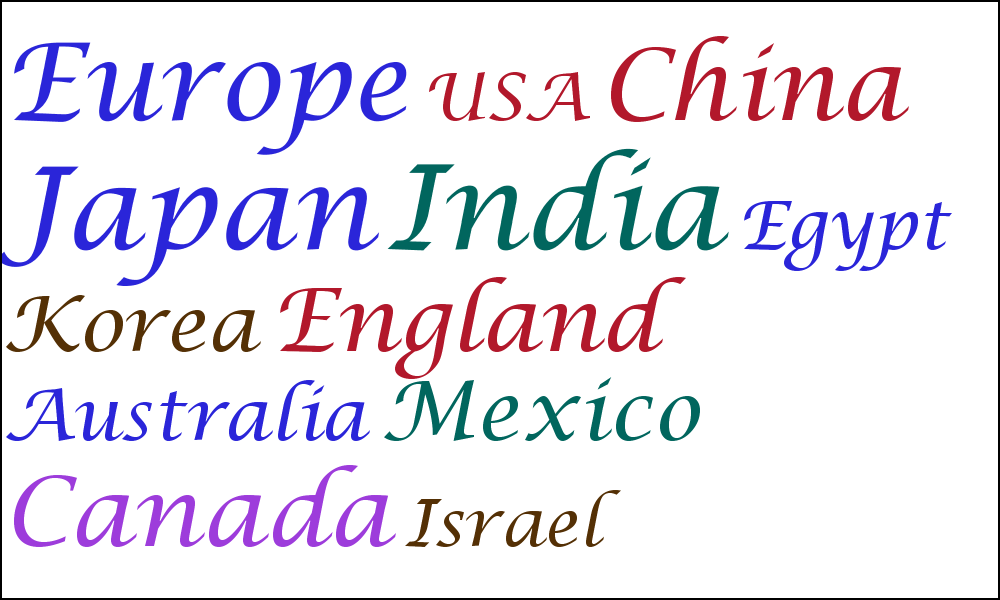 The benefit here is you can implement your own specific algorithm to lay out the strings once you know their exact dimensions. Instead of a linear word cloud, you could do a circular layout, starting from the middle. Or, turn the text sideways to fit them closer like some of the examples on the web. Here is the same data (with different size values) as a grouped word cloud.
So, we are looking for some feedback from you. Do you see use cases in your work where you could use this information to layout strings exactly where you need? Would knowing the exact pixel dimensions of something rendered in a graph help you control some aspects of the graph? Please chime in with your opinions to help us determine if such a "feedback loop" could be useful and how you could leverage it.
SAS 9.4M2 Text Plot Code: TextPlot


2 Comments
Dear Sanjay,
these are very interesting features. I've also seen a possibility to draw "path diagrams" with the Factor procedure and ODS GRAPHICS. I've checked the GTL code beneath that graph and found a plot statement called PATHDIAGRAM -- but no entry for that statement in the Template procedure help. Is there any documentation available on the Web ?
Kindest regards.
Olivier
A PathDiagram statement exists in GTL for use by the CALIS procedure. This falls in the category of statements which can handle the specific known use cases for the procedure. But we are not sure it can handle all arbitrary use cases and has not been tested for such usage. Hence it is not documented for general usage.
If this looks useful to you, we can try to make it public in the near future.