By now you have heard all about the SAS(R) STUDIO software that provides access to the power of SAS analytics in a Web browser. The SAS(R) University Edition is also available free for higher education teaching, learning and research.
This software includes ODS Graphics software for creating graphs. You can use the familiar program window to write your own SAS data step and procedures. An example of running your own SGPLOT program is shown in Robert's recent article on How to create a Histogram using the SAS University Edition.
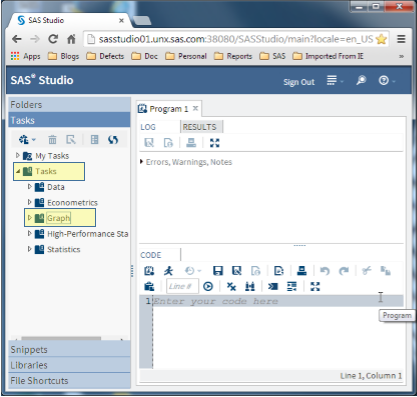 Making graphs gets even easier in SAS Studio by using the graph tasks that are included with the software. When you first launch the software, you will see the user interface shown on the right. Click on the "Tasks" button on the left, and you will see a list of tasks by category.
Here I have highlighted the Tasks folder and the Graph subfolder under it.
Multiple graph tasks are available including Bar Chart, Bar-Line Chart, Box Plot, Histogram, Line Chart, Pie Chart, Scatter Plot, Series Plot and more.
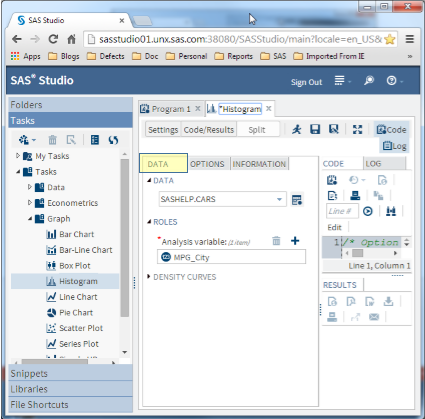 Each of these tasks presents you with a form to set the data and various options as shown on the right. Here, I have launched the "Histogram" task as shown highlighted in blue. This starts the Histogram task.
Each task presents you with an easy to use visual interface to set the parameters and options necessary to make the graph. These are all collected under two tabs - The Data tab and the Options Tab. In the image on the right, the Data tab for the Histogram task is highlighted in yellow.
Each graph task allows you to provide the name of the data set and the required variables to create the graph. In case of Histogram, you need to provide only one numeric variable for the Analysis Role. In the example above, we have selected the SASHELP.CARS data set and the MPG_CITY column for graphing.
 Once the required parameters are provided, you can submit the task by pressing the run button or 'F3'. The task will render the histogram using the default settings for styles and present the graph to you in the Results window as shown on the right.
Each task also supports optional settings which are included under the "Options" tab. These options can be used to customize your graph, including setting of titles, footnotes and graph size. In this case, I have set the graph size to 4" x 3" to fit the small region.
Each graph task generates the required SGPLOT code needed to render the graph. This code is available in the Code window under the "Code / Results" tab. This code is built and updated as you apply the settings in the Data and Options panels. So, this is a good way to get started with learning the SGPLOT procedure.
The tasks cover many of the features available in the SGPLOT procedure, but not all. So, you can cut and paste the code into the program window and customize it to your own needs.
You can learn more about creating graphs using SG procedures right here in this blog. Learn all about the procedures themselves in the book on Statistical Graphics Procedures by Example.


7 Comments
There is no option for Box Plot that I can see on SAS University Edition.
You are right.
May I know if ODS Graphics Designer is available for SAS University Edition?
My impression is that it is not included.
How may I save or print the photos or figures generated in SAS Studio?
Hello!
I'd like to run this code into SAS University edition :
proc reg data=base;
model note=id att nbach nbvod/dw;
output out=param1 r=chest ;
plot r.* nqq.;
run;
quit;
but I always get this message at the end:
WARNING: ODS graphics with more than 5000 points have been suppressed. Use the PLOTS(MAXPOINTS= ) option in the PROC REG statement
to change or override the cutoff.
ERROR: Appendage SASXGANO not found, unable to produce graphics.
Please do you know any other alternative for that.
Thanks a lot !
I cannot successfully change the number of bins for a histogram in SAS University Edition. I specified 20 bins in the Appearance Options, but I got only 11 bins. What am I missing?